Archive

September 2024

Browsing

After initially forming a fresh incremental lifetime high, the markets succumbed to selling pressure from higher levels after spending some indecisive sessions during the week. The week that went by saw some early signs of the Nifty entering into broad corrective consolidation while ending near its low point of the trading range. Given the corrective undertone, the trading range got wider as well; the Nifty 50 oscillated in a 532.35-point trading range. The volatility spiked as well; the volatility barometer India VIX surged by 13.63% to 15.22 on a weekly basis. While setting a distinct corrective undertone, the headline index closed with a net weekly loss of 383.75 points (-1.52%).

In the previous technical note, it was categorically pointed out that the Nifty stays significantly deviated from its means; the nearest 20-week MA which is at 23795 is 1057 points below the current levels. The 50-week MA which is at 22208 is currently over 2640 points below the current close. Even if the Nifty attempts a modest mean-reversion, it can see this corrective bias getting extended. The derivative data suggests that the Index has dragged its resistance levels lower; the zone of 25000-25250 is now an important resistance for the index. So long as the Nifty is below this zone, it is likely to stay prone to profit-taking bouts from higher levels.

Expect the markets to start the fresh week on a soft and tepid note. The levels of 25075 and 25250 are likely to act as resistance points for Nifty; the supports come in lower at 24600 and 24480 levels.

The weekly RSI stands at 67.74; it has slipped below the 70 levels from the overbought area which is bearish. It however stays neutral and does not show any divergence against the price. The weekly MACD is bullish and above its signal line; however, the narrowing Histogram hints at an imminent negative crossover in the coming weeks.

A Bearish Engulfing candle has emerged; the occurrence of such a candle following an uptrend has the potential to disrupt the current trend. However, this will need confirmation going ahead from here.

The pattern analysis of the weekly chart shows that the markets are showing some first signs of fatigue at higher levels. The zone of 25000-25250 has become an immediate resistance zone and until the Nifty moves past this zone convincingly, it is unlikely to show any trending move on the upside. It continues to deviate from its mean; this may keep the index somewhat vulnerable to corrective retracements.

All in all, the markets will likely continue exhibiting tentative behavior; unless the mentioned resistance zone is not taken out convincingly, the Nifty may remain under broad consolidation or corrective pressures. Defensive setup may also remain evident, pockets like IT, Pharma, FMCG, Energy, etc., may do well. Avoiding excessive leveraged exposures and staying highly selective while making fresh purchases is strongly recommended. While vigilantly guarding profits at higher levels, a cautious approach is advised for the coming week.

Sector Analysis for the coming week

In our look at Relative Rotation Graphs®, we compared various sectors against CNX500 (NIFTY 500 Index), which represents over 95% of the free float market cap of all the stocks listed.

Relative Rotation Graphs (RRG) show the Nifty Pharma, IT, Consumption, and Midcap 100 indices are inside the leading quadrant. Though the Midcap 100 index is giving up on its relative momentum, these groups are likely to relatively outperform the broader markets over the coming weeks.

The Nifty Auto and PSE Indicex are inside the weakening quadrant; the PSE pack is showing strong improvement in its relative momentum against the broader Nifty 500 index.

The Nifty Financial Services, Commodities, Infrastructure, Banknifty, PSU Bank, Metal, the Realty indices continue to languish inside the lagging quadrant are are set to relatively underperform the broader Nifty 500 index. The Nifty Energy Index is also inside the lagging quadrant; however, it is seen sharply improving its relative momentum against the broader markets.

The Media and the Services sector indices are currently placed inside the improving quadrant.

Important Note: RRG™ charts show the relative strength and momentum of a group of stocks. In the above Chart, they show relative performance against NIFTY500 Index (Broader Markets) and should not be used directly as buy or sell signals.  

Milan Vaishnav, CMT, MSTA

Consulting Technical Analyst

www.EquityResearch.asia | www.ChartWizard.ae

The American University historian who has correctly predicted the outcomes of nine of the last ten presidential elections tells Fox News Digital that the Democrats ‘finally got smart’ by rallying around Kamala Harris as their candidate – and that is one of the reasons why he thinks she will be November’s winner. 

The formula Allan Lichtman has used to correctly predict nearly every presidential race since 1984, his ‘Keys to the White House,’ was developed in 1981 with mathematician Vladimir Keilis-Borok and is based on their analysis of presidential elections dating back to 1860. The ‘keys’ consist of 13 true or false questions, parameters that, if true, favor stability. 

‘The way it works is real simple. If six or more keys — any six — go against the White House party, they are predicted losers. Otherwise, they’re predicted winners,’ Lichtman told Fox News Digital this week. ‘And by the way, this also led to a prediction of Donald Trump’s win, which made me virtually alone in making that prediction in 2016.’ 

Lichtman says the Democrats represented by Harris could lose five keys ‘at most’ and that is why he is predicting that ‘we are going to have a precedent-breaking election and Kamala Harris will become the first woman President of the United States.’ 

‘We’ve had an unprecedented situation of a sitting president dropping out on the eve of the convention, and it has affected my keys,’ Lichtman continued. ‘Now, with Biden dropping out, the Democrats lost one key — the incumbency key. I thought perhaps the way things were looking, if Biden dropped out, the [Democrats] would have a big party brawl and that would cost them a second key, which could lose them the election. But the Democrats finally got smart and united behind Harris and that preserved the contest key. That means the shift only cost them one key.’ 

Lichtman describes the contest key as having ‘no serious contest for the incumbent-party nomination.’ The other keys are as follows: party mandate, incumbency, third party, short-term economy, long-term economy, policy change, social unrest, scandal, foreign/military failure, foreign/military success, incumbent charisma and challenger charisma. 

‘I think having Harris front and center rather than Joe Biden, the policymaker, has dampened enthusiasm for protests which helped salvage a second key, the social unrest key,’ Lichtman also said. ‘The keys show that Kamala Harris is a predicted winner.’ 

Fox News’ Chris Pandolfo contributed to this report. 

This post appeared first on FOX NEWS

Prominent attorney Alan Dershowitz announced his departure from the Democratic Party, citing several ‘anti-Jewish’ lawmakers that make up the ranks of the party and the recent Democratic National Convention in which Vice President Kamala Harris became the party’s presidential nominee. 

Speaking with radio host Zev Brenner on ‘Talkline with Zev Brenner,’ Dershowitz cited the DNC, which he said gave legitimacy to anti-Israel speakers, and anti-Israel protesters outside the gathering. 

‘It was the most anti-Jewish, anti-Israel, anti-Zionist convention I’ve experienced,’ he said. ‘I was disgusted at the Democratic National Convention. Absolutely disgusted.’

‘I am no longer a Democrat. I am an Independent,’ he added, noting that he wouldn’t reveal whom he was voting for president until possibly after Nov. 1. ‘I want to see how they deal with Iran. I want to encourage the current administration to support Israel.’

The Harvard Law professor emeritus said his departure from the party was a long time coming and that he gradually resigned over time. 

‘Alot of things pushed me in that direction,’ he said. Dershowitz noted Harris’ failure to preside over a joint session of Congress during an address by Israeli Prime Minister Benjamin Netanyahu played a big role in his decision. 

Some Democrats skipped Netanyahu’s speech as a form of protest. 

Ultimately, it was the convention that was held in Chicago last month that pushed him over the edge, he said. 

He named Reps. Alexandria Ocasio-Cortez, Elizabeth Warren, Bernie Sanders, who he said were anti-Israel, and Rev. Al Sharpton, who has been accused of antisemitism in the past.

In addition, there were anti-Israel protesters outside the gathering who called for the destruction of Israel, he said. 

‘That’s not my party,’ Dershowitz said. 

The Democratic Party has seen a sharp split within its ranks following the Oct. 7 attack on Israel by Hamas. Some members of the party have refused to condemn the terror group and have blamed Netanyahu for Israel’s military response. 

Many Democrats have called for a ceasefire and urged Israel to use restraint while neglecting to hold Hamas and Hezbollah, an Iran-backed terror group based in Lebanon, in Israel’s north, to the same standard. 

This post appeared first on FOX NEWS

This week, the market appeared to shift dramatically from “stalling out at all-time highs” to more of a “big time risk-off selloff move” kind of situation. The warning signs were building in August, but, so far, September is ringing all kinds of market topping alarm bells. Let’s review three key charts that tell the story of this shift in investor sentiment.

Weaker Momentum Indicates Bulls are Exhausted

When the S&P 500 first tested the 5650 level in July, the daily RSI pushed above 80 to reinforce the strong positive momentum. Then, when that level was retested in late August, the RSI was down around 60.

What appeared to be a potential pause before an upside breakout now seems to be a confirmed double top pattern with weakening momentum characteristics. This suggests an exhaustion of bullish sentiment and looks awfully similar to previous market tops.

Looking for help navigating what will most likely be a turbulent September and beyond? Our Market Misbehavior premium membership could be the answer. From our Weekly Flight Plan report to virtual courses on technical analysis and an interactive members-only community, we’re ready to help you upgrade your market awareness! Sign up today and use code DK2024 for 30% off your first 12 months on any plan!

To be clear, the S&P 500 still remains within 5% of an all-time high.  But with the SPX down over 4% this week, and the Nasdaq 100 down almost 6%, bears appears to be back in control of the major market averages.

Elevated Volatility Implies Elevated Risks

I was super surprised to see the VIX come back down to the mid-teens in mid-August after spiking to one of its highest levels in history. Through late August, the VIX remained below the 20 level, suggesting a low-volatility environment.

This week, the VIX pushed back above that crucial 20 level, signaling elevated uncertainty and therefore elevated risk for stocks. Every day the VIX remains above 20 should give less comfort to bulls cautiously looking for a dramatic upside reversal.

Newer Dow Theory Flashes Bearish Non-Confirmation

Finally, we can look what I call the “Newer Dow Theory,” an adaptation of Charles Dow’s foundational work relating the movements of two major equity indexes. While Dow used the Dow Transports and Dow Railroads to gauge economic strength, I like to consider an equal-weighted S&P 500 and equal-weighted Nasdaq 100 to compare the performance of “old economy” versus “new economy” names.

Over the last six weeks, while the S&P 500 itself has stalled out around the 5650 level, the Invesco S&P 500 Equal Weight ETF (RSP) has actually achieved a new all-time high. At the same time, the Direxion Nasdaq 100 Equal Weighted ETF (QQQE) has actually displayed a lower peak. Dow called this configuration a “bearish non-confirmation,” where a new high from one index was not confirmed by the price action of another. And this bearish non-confirmation is a common feature of major market peaks.

As a trend-follower, I would argue that the primary trend in the S&P 500 remains bullish as long as the index remains above the August swing low around 5200. But given the growing signs of deterioration in these key macro charts, the likelihood of further downside in September feels very real.

RR#6,

Dave

P.S. Ready to upgrade your investment process? Check out my free behavioral investing course!

David Keller, CMT

Chief Market Strategist

StockCharts.com

Disclaimer: This blog is for educational purposes only and should not be construed as financial advice. The ideas and strategies should never be used without first assessing your own personal and financial situation, or without consulting a financial professional.

The author does not have a position in mentioned securities at the time of publication. Any opinions expressed herein are solely those of the author and do not in any way represent the views or opinions of any other person or entity.

In this StockCharts TV video, Mary Ellen reviews the current downtrend taking place in the S&P 500 and Nasdaq, and highlights the “uninverting” yield curve. She finishes with a deep dive into Nvidia, sharing how to handle the stock depending on your investment horizon.

This video originally premiered September 6, 2024. You can watch it on our dedicated page for Mary Ellen on StockCharts TV.

New videos from Mary Ellen premiere weekly on Fridays. You can view all previously recorded episodes at this link.

If you’re looking for stocks to invest in, be sure to check out the MEM Edge Report! This report gives you detailed information on the top sectors, industries and stocks so you can make informed investment decisions.

Which of these things is not like the others? The economy. The border. Abortion. Foreign policy. 

The first three are issues many voters consistently tell pollsters are the subjects most important to them in 2024. Foreign policy? Dwarfed by the others. In fact, recent Fox polling shows that foreign policy decisions were the most important subjects to only 3% of registered voters surveyed in Nevada, North Carolina, Georgia and Arizona. Foreign policy only climbs to 4% when Fox asked the question nationally.

So why care about foreign policy in a race like the one between Vice President Harris and former President Trump? The importance of foreign policy as a determining factor in the race for the presidency rises and falls. Vietnam wore on the public consciousness in the late 1960s. It drove former President Lyndon Johnson away from seeking re-election in 1968. The Iranian hostage crisis certainly didn’t help former President Carter as he stumbled in 1980. It’s believed that former President Reagan scored a boost from improving America’s image on the global stage. Staring down the Soviets certainly enabled Reagan to cruise to victory in 1984.

Former President George H.W. Bush seemingly received no benefit for the 1991 Gulf War nor the fall of the Eastern Bloc in the late ‘80s and early ’90s. This was ironic. The president earned a staggering 91% approval rating just after the Gulf War. Yet he lost to former President Clinton less than two years later. The events of 9/11 lifted the fate of former President George W. Bush in 2001. Bush won re-election in 2004. But casualties from the war in Iraq cost him support that fall. 

So, should we focus on foreign policy as a crucial issue in 2024? Hard to say. But in a tight race, anything might be decisive. Especially in battleground states where the race is a statistical dead heat.

‘Pocketbook issues are always the most important issues for most people,’ said Rep. Larry Bucshon, R-Ind. But Bucshon offered a caveat.

‘(Foreign policy) could be in the national security space part of the election narrative because the vice president was obviously part of this decision-making progress,’ the Indiana Republican said.

That is precisely what Republicans hope to highlight as Congress returns to session. Biden is out the door. Harris is now the Democratic nominee. And Republicans hope to tell the story of the vice president and foreign policy.

War in the Middle East. Executions of Israeli hostages. Even the controversy involving Trump honoring service members killed in Afghanistan three years ago. Curiously, the incident and questions surrounding how Trump and his team conducted themselves at Arlington National Cemetery may have actually retrained focus on why they were there in the first place: the botched withdrawal from Afghanistan under the watch of the president and vice president.

A mother of one of the 13 U.S. service members killed in the Abbey Gate attack at the Kabul airport railed against the administration.

‘We’ve been disrespected so much in the last three years,’ Kelly Barnett told Fox. She’s a Gold Star mother who lost her son, Taylor Hoover, in the terrorist attack. ‘No response from them. No ‘I’m sorry.’’

Republicans see this as connective tissue to Harris.

‘I think it’s open to criticism because the vice president was intimately involved in that discussion (to withdraw from Afghanistan),’ said Bucshon.

Harris even said as much during an interview with CNN’s Dana Bash in 2021 after the withdrawal.

‘(President Biden) just made a really big decision. Afghanistan,’ said Bash. ‘Were you the last person in the room?’

‘Yes,’ replied Harris.

‘And you feel comfortable?’ countered Bash.

‘I do,’ answered Harris.

On NBC, Rep. Ro Khanna, D-Calif., noted that former President Trump ‘was never able’ to get out of Afghanistan despite wanting to do so.

‘I give President Biden and Vice President Harris credit for finally ending a war after 20 years,’ said Khanna.

The California Democrat conceded the administration bungled the withdrawal. But Khanna believes Harris and the president ‘deserve credit’ for actually extracting the U.S. from the protracted conflict. In addition, some Republicans point to the Israel/Hamas war as a flashpoint for the administration.

‘Joe Biden and Kamala Harris have tried to hamstring Israel every step of the way here,’ Rep. Mike Lawler, R-N.Y., said on Fox.

On Fox Business, Rep. Pat Fallon, R-Texas, argued that the only ‘two-state solution’ Harris and vice presidential nominee and Minnesota Gov. Tim Walz care about is winning ‘Pennsylvania and Michigan.’

But when it comes to the Middle East, the administration contends it’s clear who is to blame — despite the Mideast crisis unfolding on its watch.

‘Hamas is responsible for their deaths. And as the president said, most leaders pay for their crimes,’ said White House national security spokesman John Kirby.

The campaign trail now moves from battleground states like Nevada and North Carolina to Capitol Hill as Congress returns to session. Expect congressional Republicans to curate a narrative about the Biden administration’s foreign policy — and latch that to Harris.

The House is slated to vote on a number of measures in the coming days pertaining to China. There may even be legislation tied to Israel and the Mideast War. The House Foreign Affairs Committee is releasing an exhaustive report about the Afghanistan withdrawal imminently. The committee also issued a subpoena to Secretary of State Antony Blinken to testify about the withdrawal Sept. 19.

The State Department contends Blinken isn’t available then. State Department spokesman Matthew Miller called the subpoena ‘unnecessary,’ arguing Blinken worked with the committee in good faith. But Foreign Affairs Committee spokeswoman Leslie Shedd said Blinken knew the committee wanted his testimony since late May.

‘The chairman offered the secretary any session day in the month of September to come in, and he refused. Instead, he vaguely suggested November or December — when it is far too late for Congress to take legislative action to fix the problems at the State Department that led to the withdrawal,’ Shedd said.

Regardless, the coming days will present lots of fodder about what went wrong in Afghanistan three years ago. House Speaker Mike Johnson, R-La., will present the families of the 13 service members killed in Afghanistan with the Congressional Gold Medal in a ceremony Tuesday.

So, do the foreign policy arguments stick to Harris? Unclear. However, you’ll notice that Republicans recently began to invoke the ‘Biden-Harris administration.’ That’s a concerted effort to pivot from Biden and Velcro issues to the vice president — once she became the nominee.

But will foreign policy make a difference? It can. But we won’t know until the vote is in. As observed earlier, George W. Bush won re-election over former Sen. John Kerry, D-Mass., in 2004. But there were ‘micro’ costs to Bush’s campaign over the Iraq war in particular regions and precincts.

And in a close election, that’s why foreign policy might matter in 2024.

This post appeared first on FOX NEWS

After a week of wavering action, the stock market made a directional move—a lot lower—after Friday’s jobs data. Investors are concerned about the economy, and the narrative has switched from inflation worries to thinking that perhaps the Fed is too late in cutting rates. Today’s MarketCarpet shows a lot of red.

It will be interesting to see how much the Fed cuts interest rates in their September meeting. As of this writing, the probability of a 25-basis point interest rate cut is 71%, with a 50-basis point probability lowering to 29%. Will this change if next week’s August inflation data comes in cooler than expected? That remains to be seen. In the meantime, let’s see how much damage occurred in equities.

Analyzing the Stock Selloff

The S&P 500 ($SPX) was holding on to the support of its 50-day simple moving average (SMA) until Friday, when it plunged toward its 100-day SMA. The stochastic oscillator has also entered oversold territory, so watch this level to see how long it stays at this level.

CHART 1. S&P 500 SELLOFF SENDS THE INDEX TOWARD ITS 100-DAY MOVING AVERAGE. Keep an eye on the stochastic oscillator or any other momentum indicator.Chart source: StockChartsACP. For educational purposes.

Is this a case of too much too quickly? It may seem that way, but if you’ve been investing for a while, you know that when the market is overextended, a quick and dirty selloff happens.

Big Tech stocks got slammed. Tesla (TSLA), one of the stronger performers this week, gave up most of those gains, falling over 6%. The rest of the Mag 7 stocks—Apple (AAPL), Amazon (AMZN), Alphabet (GOOGL), Microsoft (MSFT), Nvidia (NVDA), and Meta Platforms (META)—got slammed as well.

Broadcom (AVGO) sold off after announcing earnings on Thursday after the close, which may have added more fuel to the fire in the semiconductor selloff.

The daily chart of the VanEck Vectors Semiconductor ETF (SMH) clearly shows a downtrend. If the next low takes out the August low, the downtrend will be confirmed.

CHART 2. SEMICONDUCTORS GET SLAMMED. A downward sloping trend, dip in the SCTR score, weakness in MACD, and declining relative performance with respect to the S&P 500 point to weakness in semis.Chart source: StockChartsACP. For educational purposes.

The StockCharts Technical Rank (SCTR) score dropped to single digits after enjoying a position above 90 for an extended period. SMH closed below its 200-day SMA, the Moving Average Convergence/Divergence (MACD) is turning lower with the MACD line crossing below the signal line, and the ETF’s relative performance with respect to the S&P 500 is falling. The technical picture is not pretty.

Bonds, Oil, Crypto  

After the jobs report, Treasury yields dropped, with the 5-year yield lower by 1.44%, 10-year lower by 0.56%, and the 30-year lower by 0.07%. For the 5- and 10-year Treasuries, these are the lowest levels in a year.

Commodities also suffered, especially crude oil, which has been sliding since April. The United States Oil Fund (USO) may not have hit its yearly low like the crude oil futures, but it is getting close.

Bitcoin ($BTCUSD) is close to the lower channel of its gently sloping downtrend (see chart below). A break below this channel (dotted blue lines) could send the cryptocurrency towards 50,000 or lower. With the MACD showing weakening momentum, further decline is likely.

CHART 3. A BREAK BELOW THE LOWER TRENDLINE COULD SPELL TROUBLE FOR BITCOIN. If Bitcoin shows further weakness, it could fall much lower.Chart source: StockChartsACP. For educational purposes.

One chart I’ll be watching closely is the CBOE Volatility Index ($VIX). On a significant selloff day, I expected VIX to spike as much as it did on August 5. That it didn’t could mean more volatility lies ahead. This could send the VIX higher and higher, and might be a warning signal of further selling. That makes this something to watch very closely.

Why is the US dollar up? That’s a big question mark and something to ponder over the weekend as we prepare for next week’s inflation numbers. Expect more choppiness next week.

End-of-Week Wrap-Up

S&P 500 closed down 4.25% for the week, at 5408.42, Dow Jones Industrial Average down 2.93% for the week at 40,345.41; Nasdaq Composite closed down 5.77% for the week at 16,690.83$VIX UP 12.46% for the week closing at 22.38Best performing sector for the week: Consumer StaplesWorst performing sector for the week: TechnologyTop 5 Large Cap SCTR stocks: Insmed Inc. (INSM); Cava Group (CAVA); FTAI Aviation Ltd. (FTAI); SharkNinja, Inc. (SN); Coca-Cola Consolidated (COKE)

On the Radar Next Week

August Consumer Price Index (CPI)August Producer Price Index (PPI)August Export and Import PricesSeptember Preliminary Michigan Consumer Sentiment

Disclaimer: This blog is for educational purposes only and should not be construed as financial advice. The ideas and strategies should never be used without first assessing your own personal and financial situation, or without consulting a financial professional.

Political headwinds have recently shifted in eight close House races around the country. With less than two months until Election Day, Democrats continue to ride a wave of enthusiasm for their new presidential nominee.

Six races have shifted in Democrats’ favor, while just two are looking better for Republicans, according to a nonpartisan analysis by the Cook Political Report.

Meanwhile, Speaker Mike Johnson, R-La., has spent the summer crisscrossing the country to campaign for fellow GOP lawmakers as he seeks to hold onto his razor-thin, four-seat majority in the House.

Two of the races that inched toward the left are in districts President Biden won in 2020 but are held by GOP representatives Don Bacon, R-Neb., and Michelle Steele, R-Calif. Both their ratings switched from ‘lean Republican’ to ‘toss up.’

Rep. Mariannette Miller-Meeks, R-Iowa, who flipped her seat from red to blue in 2020, saw her race move from ‘likely’ victory for Republicans to only leaning in their favor.

Three Democratic seats — those held by representatives Jared Moskowitz, D-Fla., Marcy Kaptur, D-Ohio, and Henry Cuellar, D-Texas — have also become safer for the left.

Moskowitz and Cuellar’s race predictions shifted to solidly and ‘likely’ blue, respectively, while Kaptur’s seat is now leaning Democratic after being classified a ‘toss-up.’

Democrats could be on track to lose a seat in the House, however, with the race for Rep. Mary Peltola’s seat becoming a ‘toss-up’ in Alaska, a state former President Trump won in 2020.

Colorado’s 3rd Congressional District, which Rep. Lauren Boebert, R-Colo., is vacating to run in the nearby 4th Congressional District, is now ‘likely’ to be held by Republicans after her departure.

The Democratic Congressional Campaign Committee (DCCC), the House Democrats’ campaign arm, took a victory lap over Cook’s latest updates Friday. 

‘House Democrats continue to build momentum and grassroots enthusiasm across the country, while House GOP incumbents and candidates continue to fall flat on their faces,’ DCCC spokesperson Viet Shelton said in a statement to the press touting the update.

Republicans appeared to be on track to possibly win both the White House and Congress before Biden’s shocking decision to drop out of the 2024 presidential race in late July.

Democrats have since been riding a wave of enthusiasm for their new candidate, Vice President Kamala Harris, despite a lack of expansive policy platforms and few unscripted media appearances.

At least one House Republican who spoke with Fox News Digital this week was bullish about the GOP’s chances of victory, however.

‘If these predictive sites are to be believed, maybe Donald Trump’s got a 42% chance to be president. We’ve got a, you know, 60-some percent chance to take the Senate and a 55% chance to keep the House. So, that’s a better hand of cards than we’re holding today,’ the GOP lawmaker said. 

‘I would say this. If Donald Trump gets elected, he will likely usher in a Republican House and Senate along with him.’

Last month, House GOP leaders were expressing concerns about being out-raised by Democrats.

Rep. Richard Hudson, R-N.C., head of the House GOP campaign arm, the National Republican Congressional Committee (NRCC), confirmed he sounded alarm bells in comments to Fox Business in August.

‘That’s true, and we’ve seen the fundraising on the Democrat side just go through the roof. And so I’ve warned my candidates and my colleagues in the Congress that we’ve got to step up and continue doing the things we need to do to win,’ Hudson said at the time.

He said the response from House Republicans has been ‘great,’ adding, ‘Everyone stepped up. We had a number of people pledge more money to the committee. … I think folks are ready for the fight.’

Fox Business’ Grady Trimble and Fox News’ Tyler Olson contributed to this report

This post appeared first on FOX NEWS

Israel Prime Minister Benjamin Netanyahu is making clear that his forces will not agree to Hamas’ demands to vacate Gaza, for two crucial reasons – overall national security and ensuring the safe return of the remaining hostages still in Hamas captivity. 

Concerns continue to mount that Hamas could look to smuggle some of the remaining 97 Israeli hostages still in captivity into the Sinai Peninsula in Egypt, which has long been deemed a haven for Islamic militant groups, and where they could then be transported to Yemen or Iran.

According to Netanyahu, the best way to prevent these Hamas hostage smuggling efforts is through maintaining the contested Philadelphi Route – a security corridor that runs between the Gaza Strip and Egypt.

‘Hol[d] the Philadelphi corridor, because that possesses Hamas, that prevents them from rearming,’ Netanhyu told Fox and Friends’ Brian Kilmeade. ‘It prevents Gaza from becoming this Iranian terror enclave again, which can threaten our existence. 

‘But it’s also the way to prevent them from smuggling hostages . . . into Egypt, into the Sinai, where they could disappear,’ he added. ‘Then they’ll end up in Iran or in Yemen, and they’re lost forever.’

The prime minster’s comments echoed a report by The Jewish Chronicle that said Hamas chief Yahya Sinwar was hashing out a secret plan to smuggle himself, other Hamas leadership and some of the remaining Israeli hostages out of Gaza through the Philadelphi corridor before heading to Iran.

The chronicle cited Israeli intelligence sources, though other Israeli news outlets refuted the reporting Thursday, and Fox News Digital could not independently verify the intelligence.

In his remarks to Fox News, Netanyahu did not expand on the leverage Hamas could gain by smuggling the hostages out of Gaza, but securing the hostages’ release has increasingly taken center stage in the ceasefire negotiations.

Following the assassination of six Israeli hostages who had been held prisoner by Hamas since the Oct. 7, 2023, attacks, and who were found in the tunnels mined by the terrorist organization last month, Netanyahu has increased his opposition to U.S. efforts to push through a cease-fire agreement. 

Three of the hostages killed were reportedly supposed to be part of an exchange under a cease-fire deal proposed in July, but which never came to fruition. 

‘We’re doing everything we can to get the remainder [out],’ Netanhyu said. ‘But Hamas consistently refuses to make a deal.’

Details of the ceasefire agreement put forward by the U.S., Qatar and Egypt have remained closely guarded for months, and reporting for weeks has suggested that the most recent deal signed on by Israel, but rebuffed by Hamas, was down to Jerusalem’s refusal to vacate the Philadelphi Route. 

‘It’s just a direct falsehood,’ he said, noting that it is about more than just holding onto the corridor.

‘What we have to do is to make sure that we do two things,’ Netanyahu said. ‘One, get the hostages out. And second, keep the red lines that are necessary for Israel’s security and survival. 

‘I think both of them go through holding the Philadelphi corridor,’ he added. 

Despite Netanyahu’s strong opposition to ceding any hold of the strategic route and Hamas’ apparent refusal to hand over more hostages until Israel stops its operations in Gaza, Secretary of State Antony Blinken on Thursday said that negotiations were making significant headway. 

‘I think based on what I’ve seen, 90 percent is agreed, but there are a few critical issues that remain where we need to be able to get agreement,’ he told reporters. ‘Much of this has been discussed in recent days, including the Philadelphi corridor, including some of the exact specifics of how hostages and prisoners are exchanged.  

‘So that remains, but pretty much everything else is there,’ he added. 

Blinken said he expects in the ‘coming days’ that an updated deal will be shared by Egypt and Qatar with Hamas and by the U.S. with Israel in an attempt to shore up a cease-fire agreement. 

‘Then it will be time really for the parties to decide yes or no, and then we’ll see,’ he added. 

This post appeared first on FOX NEWS

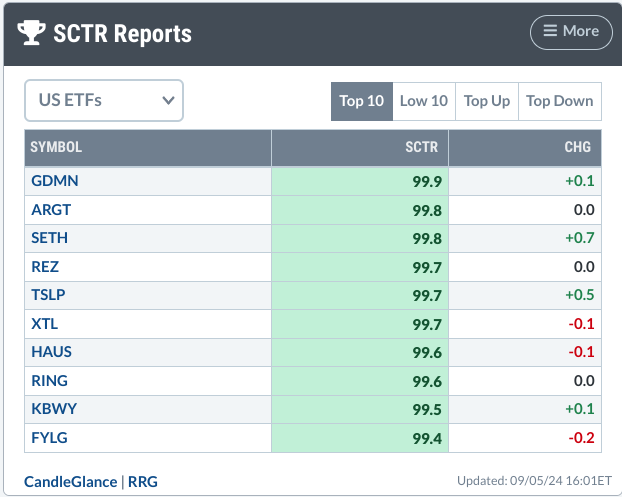
On Thursday afternoon, I dove into the StockChartsTechnicalRank (SCTR) Reports to scout out a good ETF during a mixed market (Dow and S&P 500 were down, Nasdaq was up).

Two gold miner ETFs—Wisdom Tree Efficient Gold Plus Gold Miners ETF (GDMN) and iShares MSCI Global Gold Miners ETF (RING)—caught my eye. Both had high SCTR scores of 99.9 and 99.6, respectively.

THE SCTR REPORT FOR US ETFs.

Everyone’s been talking about gold since it started climbing back in October 2022. But gold mining companies? Not so much.

Does this present an opportunity for investment, given ongoing geopolitical tensions, central bank demand, and the much-anticipated Fed rate cuts? Possibly.  But let’s dig deeper to try to get a deeper technical view as to what’s going on. 

Comparing GDMN to RING (and Gold)

First, GDMN and RING share a few of the same companies, but overall, they have different holdings. Let’s compare the performance of both companies and, out of curiosity, see how both compare to gold.

Open the StockCharts PerfCharts (under Member Tools or Charts & Tools) and enter GDMN,RING,$GOLD in the symbols box.

If you set the time parameters to one year, you get something like the chart below.

CHART 1. PERFCHART OF GDMN, RING, AND GOLD. GDMN is the red line, RING, the blue line, and gold, the green line. Chart source: StockCharts.com. For educational purposes.

Notice how both miners started outperforming gold in April, with GDMN leading the pack. But if you follow gold’s seasonality context, you know that the yellow metal dips in the summer before making a big move in the fall.

That’s gold. But what about gold miners? Let’s check the Dow Jones Gold Mining Index ($DJUSPM).

Under Charts & Tools, select Seasonality and enter $DJUSPM in the symbol box.

CHART 2. FIVE-YEAR SEASONALITY CHART OF DOW JONES GOLD MINING INDEX.  The number at the top of the bar indicates higher-close %, while the numbers at the bottom indicate average % return.Chart source: StockCharts.com. For educational purposes.

Over the last five years, August and September were the weakest months for gold miners. November and December both notched second best. March and April were the most outstanding months.

Gold demand has climbed over the last five years. Given the current economic and geopolitical context, how these numbers will pan out is unclear. But you have to check the price action if you’re bullish gold miners—and miners’ technical readings are outstandingly bullish right now.

Analyzing GDMN and RING

Are GDMN and RING the best mining indexes to trade? Both have high SCTR scores, and we know that gold miners, in general, have been on a steady rise.

But look at their trading volumes. In the Symbol Summary tool, type in each symbol.

GDMN has an incredibly low volume of 628 (no market cap listed)RING’s volume is a little better, with 41,863 and a market cap of 517M

Gold mining ETFs generally have low liquidity, making them difficult to trade. A better and more liquid representation of gold miners is the VanEck Vectors Gold Miners ETF (GDX), which has a market cap of $13.66B and an average trading volume of around 7,259,656.

Let’s analyze its daily chart.

CHART 3. DAILY CHART OF GDX. Note the clear trend swing points.Chart source: StockCharts.com. For educational purposes.

First, notice that the SCTR reading has been well above the 90 line (see green rectangle in the top panel), indicating extreme bullishness across several indicators and timeframes. The Chaikin Money Flow (CMF) has been rising since July, indicating strong buying pressure.

The Ichimoku Cloud has been a reliable indicator of support since GDX established a near-term uptrend in March. As GDX is now touching the cloud (the ETF is a candidate in the Entered Ichimoku Cloud predefined scan), it might signal a favorable entry point.

More importantly, the ZigZag line, highlighting GDX’s swing points, is key to determining the trend and entry and stop loss levels. Basically, if an uptrend is defined as higher highs and higher lows, then for GDX’s uptrend to remain valid, it has to eventually break above $40, its most recent swing high, and it can’t close below its most recent swing low of $34 (see orange circles).

At the Close

SCTR reports can be a powerful starting point for spotting market opportunities. In this case, the report led me to gold miners, but finding a truly tradable option—like GDX—required some extra research. SCTR points you in the right direction, and, with a little homework using additional StockCharts tools, you can uncover attractive trading opportunities.

Disclaimer: This blog is for educational purposes only and should not be construed as financial advice. The ideas and strategies should never be used without first assessing your own personal and financial situation, or without consulting a financial professional.