Archive

July 2025

Browsing

Here’s a quick recap of the crypto landscape for Friday (July 11) as of 9:00 p.m. UTC.

Get the latest insights on Bitcoin, Ethereum and altcoins, along with a round-up of key cryptocurrency market news.

Bitcoin and Ethereum price update

Bitcoin (BTC) was priced at US$118,036 at the end of the trading day, its highest valuation on Friday and a 4.1 percent increase in the last 24 hours. Earlier on Friday, Bitcoin saw a low of US$116,847.

Bitcoin price performance, July 11, 2025.

Chart via TradingView.

Bitcoin’s surge to a new all-time high of US$118,000 confirms a breakout above key resistance levels.

Glassnode confirms a US$4.4 billion increase in realized cap, indicating real capital inflows rather than just speculative trading. Based on data from the MVRV oscillator over the past four years, market analyst Axel Adler Jr. suggests that Bitcoin could reach approximately US$130,900 when the MVRV ratio hits 2.75, a level historically linked to profit taking and distribution. This would mark a 17 percent increase from current prices.

Some analysts have upside targets as high as US$150,000 in the weeks ahead.

The popular cryptocurrency’s rise came as investors cheered bipartisan US Senate passage of the GENIUS Act — a bill that would establish regulatory guardrails for stablecoins. The act would codify requirements for fiat-pegged stablecoins, offering investor protections while legitimizing the sector in the eyes of institutional capital.

Optimism was also supported by a softer US dollar and the Trump administration’s crypto-friendliness.

Bitcoin exchange-traded funds tracking Bitcoin have posted record volumes, drawing billions in net inflows.

Ethereum (ETH) was priced at US$3,001.99, up by 6.6 percent over the past 24 hours and just shy of an earlier peak of US$3,003.01. Its lowest valuation on Friday was US$2,593.05. ETH’s recent breakout is supported by bullish indicators suggesting a potential rally to US$3,400 if it can overcome resistance levels.

Altcoin price update

  • Solana (SOL) was priced at US$164.25, up by 3.1 percent over 24 hours. Its lowest valuation on Friday was US$162.25, and its highest was US$167.55.
  • XRP was trading for US$2.85, up 13.9 percent in the past 24 hours. The cryptocurrency’s lowest valuation was US$2.69 as the markets opened, and its highest was US$2.91.
  • Sui (SUI) is trading at US$3.51, up by 2.7 percent over the past 24 hours. Its lowest valuation was US$3.45, and its highest was US$3.56.
  • Cardano (ADA) is priced at US$0.7419, up by 13.7 percent in the last 24 hours. Its lowest valuation on Friday was US$0.7281, and its highest was US$0.7721.

Today’s crypto news to know

Ties between Trump coin and Binance under scrutiny

According to a Friday Bloomberg report citing three people familiar with the matter, cryptocurrency exchange Binance helped write the code behind USD1, the stablecoin issued by World Liberty Financial.

World Liberty Financial is one of the crypto businesses tied to US President Donald Trump and his family.

The report cites Abu Dhabi-based investment firm MGX’s announcement of a US$2 billion investment in Binance on March 12 using a then-unnamed stablecoin. Later, in May, co-founder Eric Trump said that the company would settle the investment using USD1, which was minted on the BNB chain on March 24.

The report found that 90 percent of the USD1 coins used in that transaction were still in Binance’s wallets as of Friday, where they are potentially generating tens of millions of dollars in interest for Trump and his family.

The report comes with three stablecoin bills poised for Congressional hearings and votes next week. Members of Congress have been divided over certain aspects of the legislation, with Trump’s financial ties to the industry a topic of scrutiny across the political spectrum and among various stakeholders in the financial and crypto communities.

Changpeng Zhao, former CEO of Binance, served four months in federal prison after pleading guilty to one felony count of violating anti-money laundering laws as part of a settlement with US authorities in 2023.

In May, Zhao said he was seeking a presidential pardon from Trump. In response to the new report, Zhao denied Binance’s involvement with World Liberty Financial, as well as the purchase of any World Liberty Financial coins.

Trump-linked $WLFI token gets US$100 million buy from anonymous entity

A little-known group called Aqua 1 Foundation became the largest public investor in World Liberty Financial’s crypto token $WLFI, buying US$100 million worth of the token in late June.

According to Reuters, though the foundation says it is based in the United Arab Emirates, public records offer no clarity on the group’s financial backers or its supposed founder Dave Lee.

The token purchase directly benefits the Trump family, which reportedly receives 75 percent of all $WLFI proceeds; the family’s estimated crypto earnings have now topped US$500 million.

While Aqua 1 said in a brief statement it was backed by ‘mission-aligned partners,’ it declined to offer transparency on its structure, citing privacy. US ethics experts have raised concerns over potential conflicts of interest, despite the White House stating Trump’s assets are in a trust managed by his children.

World Liberty and Trump Media & Technology Group (NASDAQ:DJT) did not respond to press inquiries.

HIVE Digital shares pop on new milestone

Hive Digital Technologies (TSXV:HIVE,NASDAQ:HIVE) opened higher on Friday after the company announced a milestone hashrate of 12 exahashes per second (EH/s), effectively doubling its output since the beginning of the year.

The company anticipates further scaling its operations to achieve 18 EH/s.

This increase in hashrate is already generating over US$250 million in annualized revenue for HIVE Digital. Projections indicate this figure could rise to US$400 million once the 18 EH/s hashrate is achieved.

“We’re building high-performance campuses at hyper speed, turning Paraguay into a global hub for sustainable Bitcoin mining data centers and laying the groundwork for the AI data center era now soaring,” said Frank Holmes, co-founder and executive chair of HIVE, in a press release.

HIVE’s rapidly expanding operations in Paraguay, a region strategically chosen for its abundant and affordable hydroelectric power, are a major driver of its growth and a focal point for the company’s future.

Beyond the technological advancements and production increases, the company is also committed to making a difference in the local communities. “We’re not just building data centers — we’re creating economic opportunity, delivering social impact by lighting the streets of Valenzuela at night and installing air conditioning in local grade schools, and developing digital infrastructure on a scale few thought possible,” said Gabriel Lamas, HIVE’s country president.

EU regulator warns crypto firms over misleading investors

The European Securities and Markets Authority (ESMA) warned crypto platforms against blurring the distinction between regulated and unregulated products under MiCA, the EU’s new crypto framework.

ESMA said many crypto firms are offering both compliant and non-compliant services on the same platform, creating investor confusion and undermining MiCA’s consumer protections. Under MiCA, only firms licensed as crypto asset service providers are allowed to market specific financial products across the EU.

However, direct investments in commodities or crypto lending still fall outside the scope of those protections. ESMA also criticized some firms for using their regulated status as a marketing tactic to legitimize riskier services.

Securities Disclosure: I, Giann Liguid, hold no direct investment interest in any company mentioned in this article.

Securities Disclosure: I, Meagen Seatter, hold no direct investment interest in any company mentioned in this article.

This post appeared first on investingnews.com


(TheNewswire)


TORONTO, ON TheNewswire – July 14 2025 –Silver Crown Royalties Inc. (‘Silver Crown’, ‘SCRi’, the ‘Corporation’, or the ‘Company’) (Cboe:SCRI,OTC:SLCRF; OTCQX:SLCRF; FRA:QS0) is pleased to announce that the Company has successfully closed the final tranche (‘Final Tranche’) of its non-brokered offering of units (‘Units’) that was previously announced on May 20, 2025 (the ‘Offering’) and issued 132,693 Units at a price of C$6.50 per Unit, for gross proceeds of approximately C$862,505.50.


  Each Unit consists of one common share (‘Common Share’) and one Common Share purchase warrant (‘Warrant’), with each Warrant exercisable to acquire one additional Common Share at an exercise price of C$13.00 for a period of three years from the closing date. A total of 235,531Units were issued in accordance with the Offering for cumulative gross proceeds of C$1,530,951.50.  


  The proceeds from the Final Tranche will be used to fund the Company’s silver royalty acquisition on the Igor 4 project in Peru, as well as general and administrative expenses. All securities issued are subject to a statutory hold period of four months plus one day from the date of issuance, in accordance with applicable securities legislation. The closing was subject to customary conditions, including the approval of Cboe Canada Inc.  


  ABOUT Silver Crown Royalties INC.  


  Founded by industry veterans, Silver Crown Royalties (   Cboe:   SCRI |   OTCQX:   SLCRF |   BF:   QS0   ) is a publicly traded, silver royalty company. Silver Crown (SCRi) currently has four silver royalties of which three are revenue-generating. Its business model presents investors with precious metals exposure that allows for a natural hedge against currency devaluation while minimizing the negative impact of cost inflation associated with production. SCRi endeavors to minimize the economic impact on mining projects while maximizing returns for shareholders.   For further information, please contact:  


  Silver Crown Royalties Inc.  


  Peter Bures, Chairman and CEO  


  Telephone: (416) 481-1744  


  Email:   pbures@silvercrownroyalties.com  


  FORWARD-LOOKING STATEMENTS  


  This release contains certain ‘forward looking statements’ and certain ‘forward-looking information’ as defined under applicable Canadian and U.S. securities laws. Forward-looking statements and information can generally be identified by the use of forward-looking terminology such as ‘may’, ‘will’, ‘should’, ‘expect’, ‘intend’, ‘estimate’, ‘anticipate’, ‘believe’, ‘continue’, ‘plans’ or similar terminology. The forward-looking information contained herein is provided for the purpose of assisting readers in understanding management’s current expectations and plans relating to the future. Readers are cautioned that such information may not be appropriate for other purposes. Forward-looking statements and information include, but are not limited to, SCRi anticipates that Elk Gold will pay this residual amount owing on or before March 31, 2025. Forward-looking statements and information are based on forecasts of future results, estimates of amounts not yet determinable and assumptions that, while believed by management to be reasonable, are inherently subject to significant business, economic and competitive uncertainties and contingencies. Forward-looking information is subject to known and unknown risks, uncertainties and other factors that may cause the actual actions, events or results to be materially different from those expressed or implied by such forward-looking information, including but not limited to: the impact of general business and economic conditions; the absence of control over mining operations from which SCRi will purchase gold and other metals or from which it will receive royalty payments and risks related to those mining operations, including risks related to international operations, government and environmental regulation, delays in mine construction and operations, actual results of mining and current exploration activities, conclusions of economic evaluations and changes in project parameters as plans continue to be refined; accidents, equipment breakdowns, title matters, labor disputes or other unanticipated difficulties or interruptions in operations; SCRi’s ability to enter into definitive agreements and close proposed royalty transactions; the inherent uncertainties related to the valuations ascribed by SCRi to its royalty interests; problems inherent to the marketability of gold and other metals; the inherent uncertainty of production and cost estimates and the potential for unexpected costs and expenses; industry conditions, including fluctuations in the price of the primary commodities mined at such operations, fluctuations in foreign exchange rates and fluctuations in interest rates; government entities interpreting existing tax legislation or enacting new tax legislation in a way which adversely affects SCRi; stock market volatility; regulatory restrictions; liability, competition, the potential impact of epidemics, pandemics or other public health crises on SCRi’s business, operations and financial condition, loss of key employees. SCRi has attempted to identify important factors that could cause actual results to differ materially from those contained in forward-looking statements, there may be other factors that cause results not to be as anticipated, estimated or intended. There can be no assurance that such statements will prove to be accurate, as actual results and future events could differ materially from those anticipated in such statements. Accordingly, readers are advised not to place undue reliance on forward-looking statements or information. SCRi undertakes no obligation to update forward-looking information except as required by applicable law. Such forward-looking information represents management’s best judgment based on information currently available.  


  This document does not constitute an offer to sell, or a solicitation of an offer to buy, securities of the Company in Canada, the United States   or any other jurisdiction. Any such offer to sell or solicitation of an offer to buy the securities described herein will be made only pursuant to subscription documentation between the Company and prospective purchasers. Any such offering will be made in reliance upon exemptions from the prospectus and registration requirements under applicable securities laws, pursuant to a subscription agreement to be entered into by the Company and prospective investors. There can be no assurance that forward-looking statements will prove to be accurate, as actual results and future events could differ materially from those anticipated in such statements. Accordingly, the reader is cautioned not to place undue reliance on forward-looking statements.  


  CBOE CANADA DOES NOT ACCEPT RESPONSIBILITY FOR THE ADEQUACY OR ACCURACY OF THIS NEWS RELEASE.  


Copyright (c) 2025 TheNewswire – All rights reserved.


News Provided by TheNewsWire via QuoteMedia

This post appeared first on investingnews.com

NVIDIA (NASDAQ:NVDA) became the first publicly traded company to hit a US$4 trillion market cap this week.

Meanwhile, Apple (NASDAQ:AAPL) made headlines with a major leadership change as rumors of a lineup of upcoming product releases circulated, and Meta Platforms (NASDAQ:META) deepened ties with one of its hardware partners.

In the chip market, Huawei is trying to capitalize on the gap left by NVIDIA’s chips in China, while a startup is stepping up its efforts to help meet its ambitious plans to expand artificial intelligence (AI) chip delivery to Saudi Arabia.

1. Apple announces leadership shift

On Tuesday (July 8), Apple announced that Jeff Williams, its longtime chief operating officer, will retire at the end of 2025, ending a tenure that spanned decades and included overseeing hardware, software and operations.

“Jeff and I have worked alongside each other for as long as I can remember, and Apple wouldn’t be what it is without him,” said Apple CEO Tim Cook in a press release. “He’s helped to create one of the most respected global supply chains in the world; launched Apple Watch and overseen its development; architected Apple’s health strategy; and led our world-class team of designers with great wisdom, heart, and dedication.’

Williams will be succeeded by Sabih Khan, Apple’s senior vice president of operations, who has played a key role in managing Apple’s global supply chain.

In other Apple news, Bloomberg reported on Wednesday (July 9) that Apple plans to release its first hardware upgrade to the Vision Pro headset later this year. Anonymous sources say the upgrades will include a a new strap for added comfort, will incorporate the same M4 processor powering newer versions of the iPad Pro, MacBook Pri and iMac, and will incorporate a great number of cores in the neural engine to run AI more effectively.

The company is also working on a lighter version slated for release in 2027, according to the people.

The company is planning a series of product upgrades for the first half of 2026, including a new entry-level iPhone 17e, refreshed MacBook Pros and MacBook Airs with M5 chips and potentially a new external display, according to multiple reports this week. Entry-level iPad and iPad Air will reportedly also receive updates.

2. Meta makes eyewear bet

Meta acquired a nearly 3 percent stake in luxury eyewear maker EssilorLuxottica (EPA:EL), the creator of Ray-Bans and the manufacturing partner for Meta’s smart glasses, including the Ray-Ban Meta and Oakley Meta lines. This is according to a Tuesday report from Bloomberg that cites unnamed sources with knowledge of the matter.

The stake is reportedly worth around 3 billion euros. According to the people, Meta is considering increasing its stake to approximately 5 percent “over time,” but noted that the plans could change.

3. Huawei seeks to step in amid US restrictions

Huawei is reportedly developing a new class of AI chips designed to support more generalized AI workloads, according to the Information, which broke the news on July 5.

According to the report, Huawei’s chip will be built around an architecture resembling that of NVIDIA’s GPU architecture (like Hopper or Blackwell) and Advanced Micro Devices’ CDNA architecture (used in their Instinct GPUs), which would allow Chinese developers to seamlessly incorporate the alternative.

Huawei’s pivot reflects China’s broader effort to bolster domestic chip capabilities as export restrictions from the US limit its access to advanced semiconductors. NVIDIA’s highly sought-after Blackwell GPUs are difficult for Chinese developers to legally acquire, leading to the development of downgraded, China-specific versions and a drive by Chinese firms to secure the chips through other means or source high-end alternatives.

Illustrating these efforts, recent Bloomberg analysis reveals ambitious plans by Chinese companies to acquire over 115,000 high-end NVIDIA chips for dozens of new AI data centers rising in the remote desert regions of Yiwu.

4. Harmonic raises US$100 million for ‘Superintelligence’

Harmonic AI, a stealth-mode AI company co-founded by Robinhood (NASDAQ:HOOD) CEO Vlad Tenev, has raised US$100 million in a Series B funding round led by Kleiner Perkins. Sequoia Capital, Index Ventures and Paradigm also participated in the round, which brought the company’s valuation to US$875 million.

Founded in 2023 by Tenev and Tudor Achim, who previously led autonomous driving startup Helm.ai, the startup is focused on building “smarter” AI models using a concept it calls “Mathematical Superintelligence.’

Its flagship model, Aristotle, is being trained to generate answers grounded in formal mathematical logic. On Bloomberg News, Tenev has said the company’s goal was to build AI systems that can solve the type of complex math problems that currently elude chatbots, eventually expanding its capabilities to physics and computer science.

Harmonic also aims to eliminate chatbot hallucinations through formal verification, a mathematical method that guarantees correct AI system function.

The startup wants to make the model available to researchers and the general public later this year.

5. Groq seeks US$6 billion valuation to fuel Saudi AI ambitions

The Information reported on Wednesday that Groq, a US-based AI chip startup and challenger to NVIDIA, is seeking to raise between US$300 million and US$500 million in a new funding round that would value it at US$6 billion.

Groq’s language processing units (LPUs) are known for their fast inferencing technology.

Unlike general-purpose GPUs, which were originally made for graphics and then adapted for AI, Groq’s LPUs were designed specifically to process language.

According to the report, the funding would help Groq fulfill a US$1.5 billion deal to deliver advanced AI chips to Saudi Arabia. With its ambitious Vision 2030, Saudi Arabia is actively pursuing a role as a global AI and technology hub, driving its interest in obtaining cutting-edge chips.

Securities Disclosure: I, Meagen Seatter, hold no direct investment interest in any company mentioned in this article.

This post appeared first on investingnews.com

Is the market flashing early signs of a shift?

In this week’s video, Mary Ellen McGonagle breaks down the subtle but telling moves happening under the surface. From strength in semiconductors, home builders, and energy to surging momentum in Bitcoin and silver, Mary Ellen highlights the sectors gaining traction and the technical setups traders should have on their radar.

She also spots stocks breaking above key moving averages, potential reversal patterns, and discusses actionable insights heading into earnings season.

If you’re looking for timely trade ideas and a roadmap to where money is flowing next, don’t miss this breakdown.

This video premiered on July 11, 2025.

You can watch it on our dedicated page for Mary Ellen’s videos.

New videos from Mary Ellen premiere weekly on Fridays. You can view all previously recorded episodes at this link.

If you’re looking for stocks to invest in, be sure to check out the MEM Edge Report! This report gives you detailed information on the top sectors, industries and stocks so you can make informed investment decisions.

NorthStar Gaming Holdings Inc. (TSXV: BET,OTC:NSBBF) (OTCQB: NSBBF) (‘NorthStar’ or the ‘Company’) today announced that its Board of Directors approved the grant of equity incentive awards pursuant to the Company’s Equity Incentive Plan (the ‘Plan’).

The Company has granted an aggregate of 5,078,913 deferred share units (‘DSUs’) pursuant to the Plan to non-executive directors of the Company in lieu of cash compensation for their services rendered in 2024. Satisfying the compensation in share-based compensation is part of the Company’s ongoing efforts to reduce costs. The DSUs vest immediately and may only be redeemed upon a holder ceasing to be a director of the Company.

The grant of DSUs is subject to the approval of the TSX Venture Exchange.

About NorthStar

NorthStar proudly owns and operates NorthStar Bets, a Canadian-born casino and sportsbook platform that delivers a premium, distinctly local gaming experience. Designed with high-stakes players in mind, NorthStar Bets Casino offers a curated selection of the most popular games, ensuring an elevated user experience. Our sportsbook stands out with its exclusive Sports Insights feature, seamlessly integrating betting guidance, stats, and scores, all tailored to meet the expectations of a premium audience.

As a Canadian company, NorthStar is uniquely positioned to cater to customers who seek a high-quality product and an exceptional level of personalized service, setting a new standard in the industry. NorthStar is committed to operating at the highest level of responsible gaming standards.

NorthStar is listed in Canada on the TSXV under the symbol BET and in the United States on the OTCQB under the symbol NSBBF. For more information on the company, please visit: www.northstargaming.ca.

No stock exchange, securities commission or other regulatory authority has approved or disapproved the information contained herein. Neither the TSXV nor its Regulation Services Provider (as that term is defined in the policies of the TSXV) accepts responsibility for the adequacy or accuracy of this press release.

Cautionary Note Regarding Forward-Looking Information and Statements

This communication contains ‘forward-looking information’ within the meaning of applicable securities laws in Canada (‘forward-looking statements’), including without limitation, statements with respect to the following: expected performance of the Company’s business, and the timing of the release of the Company’s financial results. The foregoing is provided for the purpose of presenting information about management’s current expectations and plans relating to the future and allowing investors and others to get a better understanding of the Company’s anticipated financial position, results of operations, and operating environment. Often, but not always, forward-looking statements can be identified by the use of words such as ‘plans’, ‘expects’, ‘is expected’, ‘budget’, ‘scheduled’, ‘estimates’, ‘continues’, ‘forecasts’, ‘projects’, ‘predicts’, ‘intends’, ‘anticipates’ or ‘believes’, or variations of, or the negatives of, such words and phrases, or state that certain actions, events or results ‘may’, ‘could’, ‘would’, ‘should’, ‘might’ or ‘will’ be taken, occur or be achieved. This information involves known and unknown risks, uncertainties and other factors that may cause actual results or events to differ materially from those anticipated in such forward-looking statements. This forward-looking information is based on management’s opinions, estimates and assumptions that, while considered by NorthStar to be appropriate and reasonable as of the date of this press release, are subject to known and unknown risks, uncertainties, assumptions and other factors that may cause the actual results, levels of activity, performance, or achievements to be materially different from those expressed or implied by such forward- looking information. Such factors include, among others, the following: risks related to the Company’s business and financial position; risks associated with general economic conditions; adverse industry risks; future legislative and regulatory developments; the ability of the Company to implement its business strategies; and those factors discussed in greater detail under the ‘Risk Factors’ section of the Company’s most recent annual information form, which is available under NorthStar’s profile on SEDAR+ at www.sedarplus.com. Many of these risks are beyond the Company’s control.

If any of these risks or uncertainties materialize, or if the opinions, estimates or assumptions underlying the forward-looking information prove incorrect, actual results or future events might vary materially from those anticipated in the forward-looking statements. Although the Company has attempted to identify important risk factors that could cause actual results to differ materially from those contained in the forward-looking statements, there may be other risk factors not presently known to the Company or that the Company presently believes are not material that could also cause actual results or future events to differ materially from those expressed in such forward-looking statements. There can be no assurance that such information will prove to be accurate, as actual results and future events could differ materially from those anticipated in such information. No forward-looking statement is a guarantee of future results. Accordingly, you should not place undue reliance on forward-looking information, which speaks only as of the date made. The forward-looking information contained in this press release represents NorthStar’s expectations as of the date specified herein, and are subject to change after such date. However, the Company disclaims any intention or obligation or undertaking to update or revise any forward-looking information whether as a result of new information, future events or otherwise, except as required under applicable securities laws.

All of the forward-looking information contained in this press release is expressly qualified by the foregoing cautionary statements.

For further information:

Company Contact:
Corey Goodman
Chief Development Officer 647-530-2387
investorrelations@northstargaming.ca

Investor Relations:
RB Milestone Group LLC (RBMG)
Northstar@rbmilestone.com

To view the source version of this press release, please visit https://www.newsfilecorp.com/release/258672

News Provided by Newsfile via QuoteMedia

This post appeared first on investingnews.com

The stock market continued to push higher with the S&P 500 ($SPX) and Nasdaq Composite ($COMPQ) closing at record highs on Thursday. The Dow Jones Industrial Average ($INDU) tacked on a solid 192 points (+0.43%). There was a pullback on Friday, but July is a seasonally strong month, the economy remains healthy, and volatility is low, fueling a clear risk-on vibe. 

But even in a healthy market, investors face a dilemma. The question lingers: “Should I buy now or wait for a pullback?” One often-ignored clue can help you decide: small-cap price action. 

Small Cap Stocks: The Silent Signal

Small caps have been struggling in the recent past. Every time they break above a key resistance level, they’re not able to hold their position for too long. They’re breaking out again, and this time, you’ll want them on your radar.

Since early April, small-caps have been rising along with other asset groups. The S&P 600 Small Cap Index ($SML) has broken above the 1380 level, an area that, in the past, has served as a key support level (see chart below). 

FIGURE 1. DAILY CHART OF THE S&P 600 SMALL CAP INDEX ($SML). The index broke above the 1380 level on Thursday but pulled back on Friday. If the upside move continues, it would support a higher move in the large-cap indexes. Chart source: StockCharts.com. For educational purposes.

The percentage of S&P 600 stocks trading above the 200-day moving average was above 50 on Thursday, and advances were greater than declines. The expanding breadth in small caps supports a move higher. For as long as this breadth holds, the broader market has room to keep climbing. 

In the five-year weekly chart of $SML, you can see that $SML has broken above its 40-week simple moving average (SMA). A continued move higher would support a rise in the overall market. When small caps participate in the upside move, it’s an indication that the health of the overall market is strong. We saw this happen at the end of 2023 when $SML broke above its 40-week SMA. It stayed above that moving average until the end of March 2025. During that time, the S&P 500 gained almost 50% (see figure 3). 

FIGURE 2. WEEKLY CHART OF $SML AND S&P 500. $SML broke above its 40-week SMA, supporting the S&P 500’s move higher. Chart source: StockCharts.com. For educational purposes.

In the weekly chart of the S&P 500, it’s evident that the large-cap index led the move higher. 

FIGURE 3. FIVE-YEAR WEEKLY CHART OF S&P 500. The large-cap index led the move higher, but small caps led the move lower. Chart source: StockCharts.com. For educational purposes.

But here’s where it gets interesting. If you compare the chart of $SML and $SPX, it’s clear that the small-cap index started its decline well ahead of its large-cap cousin. $SML pulled back to its 40-week SMA in early January 2025 and bounced off it. The high was lower than the previous high, the first sign of a confirmed downtrend. 

The S&P started its downtrend in early February, which was confirmed in late February when it hit resistance at its 40-week SMA and declined. The small caps rolled over first, and if you had noticed it, it would have been your first alert that large-cap stocks would soon follow. 

Will Small Caps Outrun Large Caps?

In an environment where capital is rotating into growth stocks, it’s unlikely small caps will outperform large-cap stocks. In the chart of the SPDR Portfolio S&P 600 Small Cap ETF (SPSM) vs. the S&P 500 ETF (SPY), between 2023 and 2025, small caps underperformed the large caps. (Note: This chart can be accessed from the Market Summary page.)

FIGURE 4. PERFORMANCE OF SMALL CAPS. VS. LARGE CAPS. Between 2023 and 2025, small caps underperformed large caps. Chart source: StockCharts.com. For educational purposes.

The takeaway: Since small caps lead the broader market lower, investors should make it a point to monitor their price action, especially when the stock market continues to rise. 

Add $SML or a small-cap proxy such as the iShares Russell 2000 ETF (IWM) or the SPDR Portfolio S&P 600 Small Cap ETF (SPSM) to your ChartLists. When you see a confirmed downtrend in small caps, expect a pullback in large caps. It may not happen immediately, but at least you’ll be better prepared for the next significant pullback or correction.  

Closing Position

Small-cap stocks may not take the place of the large-cap growth stocks in your portfolio, but they silently signal the market’s next move. By monitoring $SML and small-cap proxies on StockCharts, you’ll get an early heads-up, which will allow you to act with confidence — whether that means trimming your winners, adding hedges, or jumping into new setups.

Are you ready to follow the price action in the charts? Log in to your StockCharts.com account, click on the charts in this article, and save them to your ChartLists.


Disclaimer: This blog is for educational purposes only and should not be construed as financial advice. The ideas and strategies should never be used without first assessing your own personal and financial situation, or without consulting a financial professional.

Up to this point, the S&P 500 ($SPX) has now stayed above the 6,200-mark for eight straight days. The upside follow-through has been limited, but the drawdown has also been shallow. The onus continues to be on the bears to do something with the stretched state. We discuss this in terms of the CappThesis Market Strength Indicator below.

What Is the Market Strength Indicator (MSI)?

When the market makes strong moves, like they have recently, I like to review our Market Strength Indicator (MSI).  This isn’t some secret, proprietary formula. It’s a simple blend of trend, oscillator indicators, and patterns, factors that we base our market stance upon.

And surprise, surprise, the MSI is as bullish as can be with the SPX at new highs and up 30% in three months.

  1. The S&P 500 is trading above each moving average, and each moving average is sloping higher.
  2. The 14-day Relative Strength Index (RSI) and Williams %R are both overbought. We use both of these since it takes a considerable up move to get the RSI to overbought territory. And while the Williams %R swings to extremes much more easily, it can only stay overbought if the market continues to tick higher with minimal drawdowns. Clearly, all of this has been happening.
  3. And, of course, two big pattern breakouts remain in play. Two weeks ago, the MSI was even more extreme when we had four patterns in play at the same time.

Here are each of those indicators together on one chart. (We don’t show the patterns here since it would be way too much to display all at once – and that would be an offensive chart crime.)

The clear next question:

Now what?

Market Strength Indicator Now vs. April 7, 2025

First, the obvious. The MSI was completely depressed on April 7 after two months of intense selling and extreme volatility.

Interestingly, though, after that last massive downside gap on April 7, the final bearish pattern target was hit. That set the stage for a bottoming process to potentially begin.

With the pendulum now having completely swung from historically oversold to now extended, does a very bullish MSI suggest the upswing is unsustainable?  

Bulls and bears agree on one thing these days: The pace of the last three months can’t continue, and at any time, a pullback greater than the 3.5% drop from mid-May is going to happen. It’s just a matter of when. 

Now let’s look at the recent times when the MSI got to extreme levels like now.

Market Strength Indicator Now vs. 2023–24

The results are crystal clear. “Extreme” MSI readings are the result of strong technicals, which occur in uptrends. And uptrends tend to last longer than many think is possible or probable.

From this perspective, only once did a correction begin right after a high MSI reading – in July’24. At the time, though, only one bullish pattern was in play (the one with the long-term 6,100 target that was triggered way back in Jan’24). 

Now, of course, we have two live bullish formations, and for the uptrend to persist without a major market disturbance, we’ll need to see the next bout of profit-taking morph into the next set of short-term bullish formations.

Live Patterns

Our two live patterns remain – targets of 6,555 and 6,745, which could be with us for a while going forward. For those to eventually be achieved, though, new, smaller versions will need to be constructed.

Live Patterns

Our two live patterns remain – targets of 6,555 and 6,745, which could be with us for a while going forward. For those to eventually be achieved, though, new, smaller versions will need to be constructed.

If you’re serious about trading or investing, establishing a weekly market routine is a must. But where do you begin?  

In this eye-opening video, Grayson Roze, Chief Strategist at StockCharts, shares the method he uses every week to stay aligned with the market’s biggest drivers — the top 25 stocks by market cap

Learn how to build a customized ChartList of these stocks, sort the stocks by market cap, and different ways to review them to spot long-term trends or reversals.

Whether you’re new to charting or a seasoned technician, this routine could transform how you view the market. 

This video originally premiered on July 11, 2025. Click on the above image to watch on our dedicated Grayson Roze page on StockCharts TV.

You can view previously recorded videos from Grayson at this link.

The S&P continues to push higher, with the equity benchmark almost reaching 6300 this week for the first time in history. With so many potential macro headwinds still surrounding us, how can the market continue to reflect so much optimism? On the other hand, when will bulls wake up and realize that this market is obviously overextended and rotate significantly lower?

With the S&P 500 once again achieving new all-time highs, and with Q2 earnings just around the corner, I thought it would be a perfect time to revisit an exercise in probabilistic analysis. Basically, I’ll lay out four different scenarios for the S&P 500 index between now and late August. Which path do you see as the most likely and why? Watch the video, check out the first scenarios, and then cast your vote!

By the way, we last ran this analytical process on the S&P 500 back in May, and check out which scenario actually played out!

And remember, the point of this exercise is threefold:

  1. Consider all four potential future paths for the index, think about what would cause each scenario to unfold in terms of the macro drivers, and review what signals/patterns/indicators would confirm the scenario.
  2. Decide which scenario you feel is most likely, and why you think that’s the case. Don’t forget to drop me a comment and let me know your vote!
  3. Think about how each of the four scenarios would impact your current portfolio. How would you manage risk in each case? How and when would you take action to adapt to this new reality?

Let’s start with the most optimistic scenario, with the S&P 500 index continuing the recent uptrend phase to retest all-time highs by June.

Option 1: The Super Bullish Scenario

The most bullish scenario would involve the S&P 500 continuing a similar trajectory that we’ve seen off the April low. Growth continues to dominate, tariffs remain essentially a non-issue, volatility remains lower, and the market moves onward and ever upward!

Dave’s Vote: 10%

Option 2: The Mildly Bullish Scenario

What if the uptrend continues, but at a much slower rate? The “mildly bullish scenario” would mean the S&P 500 probably tops out around 6300-6400 but doesn’t get any further. Perhaps a leadership rotation emerges, and technology stocks start to pull back as investors rotate to other sectors and themes. Lack of upside momentum from the largest growth names slows the uptrend in a big way.

Dave’s vote: 30%

Option 3: The Mildly Bearish Scenario

Maybe “the top” is already in, and even though July is traditionally a strong month, we see a corrective move into August that brings the S&P 500 down to the 200-day moving average. Bulls and bears would probably feel quite vindicated here, as bulls would see this as a healthy pullback, and bears would see this as a serious wake up call for investors.

Dave’s vote: 45%

Option 4: The Very Bearish Scenario

We always need a doomsday scenario, and here we’ll describe how the S&P 500 could go back down to retest the May price gap. If Q2 earnings season becomes all about companies reflecting on a significantly negative impact from potential tariffs, and investors begin to not just complain about overvalued stocks but actually start selling as a result, we could certainly see a downside move to retrace about 38.2% of the April to July uptrend phase.

Dave’s vote: 15%

What probabilities would you assign to each of these four scenarios? Check out the video below, and then drop a comment on which scenario you select and why!

RR#6,

Dave

PS- Ready to upgrade your investment process?  Check out my free behavioral investing course!

David Keller, CMT

Chief Market Strategist

StockCharts.com

Disclaimer: This blog is for educational purposes only and should not be construed as financial advice.  The ideas and strategies should never be used without first assessing your own personal and financial situation, or without consulting a financial professional.  

The author does not have a position in mentioned securities at the time of publication.    Any opinions expressed herein are solely those of the author and do not in any way represent the views or opinions of any other person or entity.

As we navigate the evolving stock market landscape, understanding key sectors and their trends is important, especially during earnings season. This week, the spotlight shines on the Financial sector, with several of the largest banks reporting. Five of the top 10 holdings within the Financial Select Sector SPDR ETF (XLF) are on deck: J.P. Morgan (JPM), Goldman Sachs (GS), Bank of America (BAC), Wells Fargo (WFC), and Morgan Stanley (MS). 

This week we will focus on the Financial sector via XLF and zoom in on one of its top components, Goldman Sachs.

The Financial Sector: A Technical Look at XLF

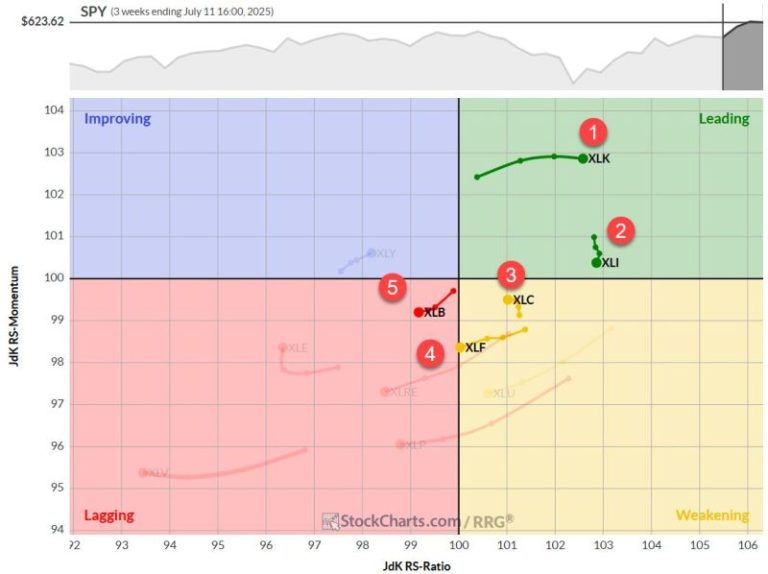
XLF has been outperforming the S&P 500 ($SPX), experiencing new all-time highs, and has been a leading sector in the most recent market rebound.

Now that all banks that were susceptible to the Fed’s stress test have passed with flying colors, questions loom about whether less stringent regulations will lead to more growth. The sector has not experienced much M&A activity, and the IPO market has yet to come back to a healthy level of activity. However, there is hope that a banking renaissance is on the horizon, and maybe this quarter will give a rosier outlook than more recent forecasts.

Technically, XLF looks promising. Shares broke out to new all-time highs ahead of earnings and are now set up with good risk/reward potential for investors. 

The pattern from which it broke out is a bit of a wonky head-and-shoulders pattern. I’d call this a stretch as it isn’t picture perfect, but the price image presented is close enough to set parameters to trade. 

The breakout on a gap to new highs is extremely bullish, and that gap level could be used as a stop-loss to the downside, worst case should be the rising 50-day moving average. Buyers should come back into the sector there on a dip.

Goldman Sachs (GS): A Bellwether

Goldman Sachs, the largest component in the price-weighted Dow Jones Industrial Average, reports results on Wednesday morning just days after hitting all-time highs. Investors will be looking for any commentary focused on tariffs and margins. 

Has there been any impact on their results, or have concerns about inflation been overblown? Any earnings pressure on their bottom line could cause ripple effects throughout other sectors like industrials, materials, and technology. 

Shares declined 33% then rallied 65% from their April 7 lows. Shares may need a breather as they are overbought, but that’s where opportunity may lie. Wouldn’t chase it just yet. I would own for the long term, but price action could be very interesting when they report next week. 

One bold prediction — look for a possible stock split announcement. Since their debut in 1999, shares have never split. Seeing the recent price surge and its size in the Dow, that option should be on the table. 

Technically, shares have been on a tremendous run as they’ve rallied 65% from their April 7 lows. Shares may need a breather as they are overbought, but that may be where the opportunity lies when they report next week. 

The stock has rallied with a series of gaps along the way. Those gaps tell a story, and it’s worth watching the most recent gap from $690 to $700. Each jump higher has not experienced a full retracement — a gap fill, if you will.

The gaps higher have been very bullish. The first large gap — a breakaway gap — started the main part of this rally. We have seen a series of smaller gaps that helped extend the rally. Now, we may be tiring. Watch the $690 level to see if that gap can hold. If it can’t, then there may be more selling pressure over the near term. 

A healthy pullback given the strong bull run is likely, but buyable. A break below $690 could see a swift move lower to the $665 level. If things turn negative, then the rising 50-day moving average, which coincides with a key Fibonacci retracement level just below $620 would be an ideal entry point from a risk/reward perspective. 

The good news is that any weakness in the stock looks like it should be met with great opportunities to enter the name. The long-term trend is up, and the momentum is there not only in the stock but within the sector. The long-term trader shouldn’t fret earnings; the swing trader may get an opportunity to buy a dip from an overbought condition. The bad news would be that the stock gaps higher again and continues its upward trajectory. 

Beyond Financials: Johnson & Johnson (JNJ)

While financials take center stage, we want to touch upon another significant company reporting this week: Johnson & Johnson (JNJ).

JNJ shares have remained relatively flat for the better part of five years. Much of the earnings focus will be on plans to navigate patent expirations. 

Merck acquired Verona last week. The patent cliff will continue to be a hot topic for the entire pharma industry. As for JNJ, it’s confronting the expiration of exclusivity on Stelara, its $10B+ immunology blockbuster drug. The exclusivity expires first in Europe this year and then in the U.S. in 2026.

As for reaction to earnings, don’t expect too much activity. The average move post-results has been +/- 2.05%. Shares have traded lower after five of the last seven times. Shares of the Dow stock are up 8% year-to-date and -9% off their highs.

Technically, there isn’t much to see here. We backed it out to look at price in a five-year weekly range to illustrate that point.

Shares have been in a wide range between roughly $138 to $168 over this lengthy span. Yes, I yawned when I typed this out — it’s that boring. We don’t expect much to change, but there are small setups for a shorter-term swing trader.

The stock, while breaking above the midpoint of this longer-term range, is forming a bullish ascending triangle and has, albeit tight, risk/reward parameters for those looking to trade. 

To the downside, look for the continued near-term uptrend to hold and find support right at the 200-day moving average just below $153. A good entry point in which one could manage risk. 

To the upside, a break above $158 could take shares to their recent highs and slowly and steadily towards the $168 level. The set-up is far from ideal when looking at the longer-term action, but near term, there could be a quick play and maybe, just maybe, shares can finally escape the longer-term neutral range.