Archive

July 1, 2025

Browsing

A Greek Odyssey

First of all, I apologize for any potential delays or inconsistencies this week. I’m currently writing this from a hotel room in Greece, surrounded by what I can only describe as the usual Greek chaos. Our flight back home was first delayed, then canceled, then rescheduled and delayed again. So instead of being back at my desk as planned, I’m getting back into the trenches from a small Greek town. But the markets wait for no one, so here we are!

Market Sector Shifts: Tech Takes the Lead

The changes in our top five aren’t massive, but they’re certainly worth noting. Technology has muscled its way back to the #1 spot, nudging Industrials down to second. Communication Services and Utilities are holding steady at positions #3 and #4 respectively. The most interesting move, imho, is Financials re-entering the top five at #5, up from #7 last week.

Real estate remains just outside at #6, while Consumer Staples has dropped out of the top five, landing at #7. Materials and Energy are still bringing up the rear at #8 and #9. In a bit of musical chairs, Consumer Discretionary and Health Care have swapped places — Discretionary now at #10 and Health Care down to #11.

  1. (2) Technology – (XLK)*
  2. (1) Industrials – (XLI)*
  3. (3) Communication Services – (XLC)
  4. (4) Utilities – (XLU)
  5. (7) Financials – (XLF)*
  6. (6) Real-Estate – (XLRE)
  7. (5) Consumer Staples – (XLP)*
  8. (8) Materials – (XLB)
  9. (9) Energy – (XLE)
  10. (11) Consumer Discretionary – (XLY)*
  11. (10) Healthcare – (XLV)*

Weekly RRG

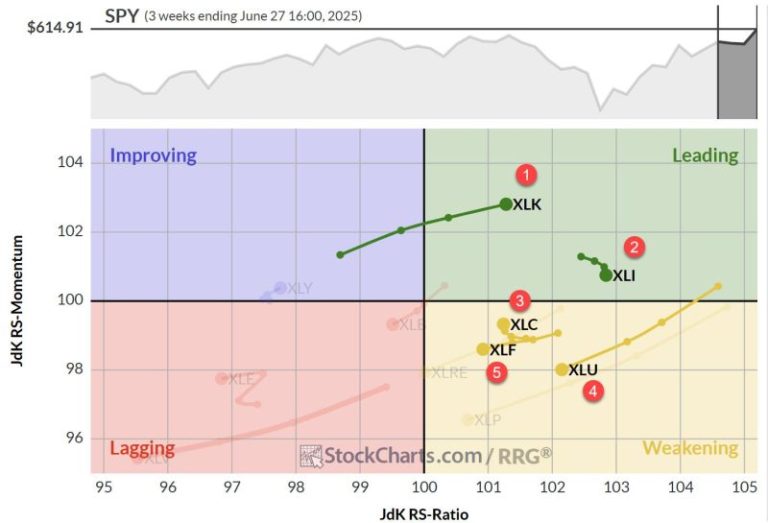
The weekly Relative Rotation Graph (RRG) paints a clear picture of Technology’s strength as it powers further into the leading quadrant. Industrials is still in the lead, but has started to lose some relative momentum — though it’s maintaining the highest RS-ratio reading. Communication Services is showing a clear upward rotation, while Financials and Utilities are inside the weakening quadrant with negative headings (but still above the 100 level, keeping them in the top five).

Daily RRG

  • Technology and Communication Services flexing their muscles in the leading quadrant
  • Industrials inside lagging, but turning back up
  • Financials in improving on a positive heading
  • Utilities rotating back down at a negative heading, close to crossing into lagging

The sector at risk here is clearly Utilities — at least for now.

Technology

The Technology sector chart is showing a very clear breakout above the resistance area around 240. It’s a decisive move, and that old resistance should now act as support. This breakout is mirrored in the relative strength line, which has continued its upward trajectory after breaking out of the falling channel.

Industrials

Industrials are also flexing their muscles, clearing overhead resistance with a nice breakout. The relative strength line, already out of its consolidation pattern, appears to be gaining momentum again. This is starting to drag the RS ratio line higher.

Communication Services

Communication Services is showing a clear upward break over the 105 resistance area. Just like Tech and Industrials, that old resistance is now expected to act as support. The price strength is finally reflected in the relative strength line, which has started to move up against the rising support line. This is causing the RS momentum line to pull up, almost crossing back over the 100 level, which should, in turn, push Communication Services back into the leading quadrant on the weekly RRG.

Utilities

Utilities, one of the defensive sectors in this cyclical power play, has remained static within its range. But in this market, standing still means losing relative strength. The utility sector is becoming increasingly at risk, with its relative strength chart returning to the trading range and heading towards the lower boundary. This is dragging the RRG lines lower.

Financials

Financials, our new entrant in the top five, is still grappling with the old rising support line and overhead resistance level. However, last week’s price action seems to have broken the sector out of a small consolidation pattern. If Financials can now take out the overhead resistance just above 52, it’ll be a powerful sign for this sector.

Portfolio Performance

From a portfolio performance perspective, we’re getting hurt by the strength of the Technology sector. It’s in the portfolio, but not enough to keep up with the S&P 500’s performance. We’re still underperforming by around 8%.

To turn this situation around, we need sustained moves higher by Technology, Communication Services, and potentially Financials. If Consumer Discretionary could join the party at some stage, that would be ideal — but it’s still far off at #10. For now, we’ll have to work with what we’ve got, especially from Tech and Communication Services, with potential boosts from Financials and Industrials. Utilities are likely to be a drag while they remain in the top five, given the current bullish market sentiment.

#StayAlert and have a great week. –Julius


In this video, Mary Ellen spotlights key pullback opportunities and reversal setups in the wake of a strong market week, one which saw all-time highs in the S&P 500 and Nasdaq. She breaks down the semiconductor surge and explores the bullish momentum in economically-sensitive sectors, including software, regional banks, and small-caps. Watch as she highlights top stocks to add to your watchlist, including FedEx, XPO, CHRW, and RL, plus identifies downtrend reversal candidates like AeroVironment (AVAV) and Nike, supported by volume and technical breakouts. In addition, she covers smart entry tactics, examining historical precedent with Coinbase.

This video originally premiered on June 27, 2025. You can watch it on our dedicated page for Mary Ellen’s videos.

New videos from Mary Ellen premiere weekly on Fridays. You can view all previously recorded episodes at this link.

If you’re looking for stocks to invest in, be sure to check out the MEM Edge Report! This report gives you detailed information on the top sectors, industries and stocks so you can make informed investment decisions.

Below is the EB Weekly Market Report that I sent out earlier to our EarningsBeats.com members. This will give you an idea of the depth of our weekly report, which is a very small piece of our regular service offerings. We called both the stock market top in February and stock market bottom in April, and encouraged EB members to lower risk at the time of the former and increase risk at the time of the latter.

There is no better time to experience our service for yourself as we’re currently running a FLASH SALE that offers a 20% discount on annual memberships. The timing to join couldn’t be better as I’ll be providing my Q3 outlook to all EB annual members at 5:30pm ET today. A recording will be provided for those who cannot attend the session live. So if you sign up later today or tomorrow or the next day, we’ll make sure you get a time-stamped copy of the recording.

In the meantime, enjoy this complimentary copy of this week’s report….

ChartLists/Spreadsheets Updated

The following ChartLists/Spreadsheets were updated over the weekend:

  • Strong Earnings (SECL)
  • Strong Future Earnings (SFECL)
  • Strong AD (SADCL)
  • Raised Guidance (RGCL)
  • Bullish Trifecta (BTCL)
  • Short Squeeze (SSCL)
  • Leading Stocks (LSCL)
  • Manipulation Spreadsheet*

*We continued to add more stocks to our Manipulation Spreadsheet and you’ll see that a few have tabs, but do not have data yet. Those 3 are still “under construction”. I also added a “Summary” tab where I’ve begun to sort the individual stocks in order based on a proprietary relative AD ranking system. Don’t ask me what it means yet, because it’s still very much a work in progress as well. I’m looking at the intraday relative performance of individual stocks vs. the benchmark S&P 500. So positive percentages represent better intraday AD performance than the S&P 500, while negative percentages represent the opposite. One thing I’ll be watching is to see if stronger relative AD lines precede relative strength in stocks on a forward-looking basis. It certainly did in the case of both Netflix (NFLX) and Microsoft (MSFT) from several weeks ago when I pointed out what appeared to me to be significant accumulation in March/April when the stock market bottomed. Both NFLX and MSFT have soared since that time. I’ll keep everyone posted on the progress of my research over the next many weeks and months.

Weekly Market Recap

Major Indices

Sectors

Top 10 Industries Last Week

Bottom 10 Industries Last Week

Top 10 Stocks – S&P 500/NASDAQ 100

Bottom 10 Stocks – S&P 500/NASDAQ 100

Big Picture

If you’re a long-term investor, stepping back and looking at the stock market using this 100-year chart enables you to avoid pulling unnecessary sell triggers, because of the media, permabears, negative nellie’s, and all the “news” out there. The above chart never once flashed anything remotely signaling a sell signal and now, here we are, back at all-time highs. Simply put, it filters out all the noise that we hear on a day-to-day basis and keeps our wits about us.

Sustainability Ratios

Here’s the latest look at our key intraday ratios as we follow where the money is traveling on an INTRADAY basis (ignoring gaps):

QQQ:SPY

Absolute price action on both the S&P 500 and NASDAQ 100 has now seen all-time high breakouts, which alone is quite bullish. We want to see aggressive vs. defensive (or growth vs. value) ratios moving higher to indicate sustainability of any S&P 500 advance. In my view, we’re seeing that. But the intraday QQQ:SPY ratio continues to hesitate. A breakout in this intraday relative ratio would most definitely add to the current bullish market environment.

IWM:QQQ

I’m seeing signs of an impending rate cut by the Fed. However, if I’m being completely honest, one signal that we should see is outperformance in small caps and a rising IWM:QQQ ratio. That hasn’t happened – at least not yet. If a rate cut starts to become clearer, I would absolutely expect to see much more relative strength in small caps. Keep an eye out for that.

XLY:XLP

I pay very close attention to the XLY:XLP ratio and, more specifically, this INTRADAY XLY:XLP ratio. This chart helped me feel confident in calling a market top back in January/February. If you recall, that’s when we said it was waaaaay too risky to be long the U.S. stock market. By the time we had bottomed in April, the blue-shaded area highlighted the fact that the XLY vs. XLP ratio had already begun to SOAR! That’s why, on Friday, April 11th, I said I was ALL IN on the long side again.

These signals are golden and, when used in conjunction with all of our other signals, can provide us extremely helpful clues about stock market direction. If these ratios begin to turn lower in a big way, then yes we’ll need to grow more cautious. However, right now, they couldn’t be any more bullish. Expect higher prices ahead.

Sentiment

5-day SMA ($CPCE)

Sentiment indicators are contrarian indicators. When they show extreme bullishness, we need to be a bit cautious and when they show extreme pessimism, it could be time to become much more aggressive. Major market bottoms are carved out when pessimism is at its absolute highest level.

The S&P 500 had struggled a bit once 5-day SMA readings of the CPCE fell to the .55 area, a sign of market complacency and a possible short-term top. We saw a bit of a pullback in June, which many times is all we get during a secular bull market advance. My sustainability ratios are supporting a higher move by stocks and I know from history that overbought conditions can remain overbought. I also know that sentiment does a much better job of calling bottoms than it does calling tops. That’s why I will not overreact every time this 5-day moving average of the CPCE falls back below .55. During Q4 2024, we saw plenty of 5-day SMA readings below .55 and, while the S&P 500 was choppy, bullishness prevailed throughout. So just please always keep in mind that these 5-day SMA readings are our “speed boat” sentiment indicator that changes quite frequently. When it lines up with other bearish or topping signals, we should take note. But reacting to every subtle move in this chart is a big mistake, in my opinion.

253-day SMA ($CPCE)

This longer-term 253-day SMA of the CPCE is our “ocean-liner” signal, unlike our speedboat indicator. This one usually provides us a very solid long-term signal as the overall market environment moves from one of pessimism to complacency and vice versa. Look at the above chart. When the 253-day SMA is moving lower like it is now, it accompanies our most bullish S&P 500 moves. It makes perfect common sense as well. Once this 253-day SMA moves to extremely high levels and begins to roll over, the bears have already sold. We typically have nowhere to go on our major indices, except higher once sentiment becomes so bearish. The opposite holds true when the 253-day SMA reaches extreme complacency and starts to turn higher. We saw that to start 2022, which, at the time, I stated was my biggest concern as we started 2022. If you recall, I said to look for a 20-25% cyclical bear market over a 3-6 month period on the first Saturday in January 2022. The above chart was my biggest reason for calling for such a big selloff ahead of the decline.

These charts matter.

Long-Term Trade Setup

Since beginning this Weekly Market Report in September 2023, I’ve discussed the long-term trade candidates below that I really like. Generally, these stocks have excellent long-term track records, and many pay nice dividends that mostly grow every year. Only in specific cases (exceptions) would I consider a long-term entry into a stock that has a poor or limited long-term track record and/or pays no dividends. Below is a quick recap of how these stocks looked one week ago:

  • JPM – challenging all-time high
  • BA – substantial improvement, would like to see 185-190 support hold
  • FFIV – very bullish action above its 20-month SMA
  • MA – very steady and bullish long-term performer
  • GS – trending higher above 20-month EMA
  • FDX – trying to clear falling 20-week EMA
  • AAPL – monthly RSI at 50, which has been an excellent time to buy AAPL over the past two decades
  • CHRW – 85-90 is solid longer-term support
  • JBHT – would like to see 120-125 support hold
  • STX – long-term breakout in play, excellent trade
  • HSY – breaking above 175 would be intermediate-term bullish
  • DIS – now testing key price resistance in 120-125 range
  • MSCI – monthly RSI hanging near 50, solid entry
  • SBUX – moved back above 50-week EMA, short-term bullish
  • KRE – long-term uptrend remains in play
  • ED – has been a solid income-producer and investment since the financial crisis low in 2009
  • AJG – few stocks have been steadier to the upside over the past decade
  • NSC – continues to sideways consolidate in very bullish fashion
  • RHI – trending down with potential sight set on 30
  • ADM – looks to be reversing higher off long-term price support near 43
  • BG – 65-70 price support held, now looking to clear 50-week SMA to the upside
  • CVS – excellent support at 45 or just below, just failed on bounce at 50-month SMA at 72
  • IPG – monthly RSI now at 37 and also testing 4-year price support near 22.50
  • HRL – long-term price support at 25 and stock now showing positive divergence on monthly chart – bullish
  • DE – one of the better 2025 momentum stocks on this list

Keep in mind that our Weekly Market Reports favor those who are more interested in the long-term market picture. Therefore, the list of stocks above are stocks that we believe are safer (but nothing is ever 100% safe) to own with the long-term in mind. Nearly everything else we do at EarningsBeats.com favors short-term momentum trading, so I wanted to explain what we’re doing with this list and why it’s different.

Also, please keep in mind that I’m not a Registered Investment Advisor (and neither is EarningsBeats.com nor any of its employees) and am only providing (mostly) what I believe to be solid dividend-paying stocks for the long term. Companies periodically go through adjustments, new competition, restructuring, management changes, etc. that can have detrimental long-term impacts. Neither the stock price nor the dividend is ever guaranteed. I simply point out interesting stock candidates for longer-term investors. Do your due diligence and please consult with your financial advisor before making any purchases or sales of securities.

Looking Ahead

Upcoming Earnings

Very few companies will report quarterly results until mid-April. The following list of companies is NOT a list of all companies scheduled to report quarterly earnings, however, just key reports, so please be sure to check for earnings dates of any companies that you own. Any company in BOLD represents a stock in one of our portfolios and the amount in parenthesis represents the market capitalization of each company listed:

  • Monday: None
  • Tuesday: STZ ($29 billion)
  • Wednesday: None
  • Thursday: None
  • Friday: None

Key Economic Reports

  • Monday: June Chicago PMI
  • Tuesday: June PMI manufacturing, June ISM manufacturing, May construction spending, May JOLTS
  • Wednesday: June ADP employment report
  • Thursday: Initial jobless claims, June nonfarm payrolls, unemployment rate & average hourly earnings, May factory orders, June ISM services
  • Friday: None – stock market closed in observance of Independence Day

Historical Data

I’m a true stock market historian. I am absolutely PASSIONATE about studying stock market history to provide us more clues about likely stock market direction and potential sectors/industries/stocks to trade. While I don’t use history as a primary indicator, I’m always very aware of it as a secondary indicator. I love it when history lines up with my technical signals, providing me with much more confidence to make particular trades.

Below you’ll find the next two weeks of historical data and tendencies across the three key indices that I follow most closely:

S&P 500 (since 1950)

  • Jun 30: +34.34%
  • Jul 1: +72.77%
  • Jul 2: +16.76%
  • Jul 3: +77.19%
  • Jul 4: +0.00% (market closed – holiday)
  • Jul 5: +39.40%
  • Jul 6: +22.32%
  • Jul 7: +17.62%
  • Jul 8: -16.29%
  • Jul 9: +76.54%
  • Jul 10: -16.59%
  • Jul 11: +13.23%
  • Jul 12: +36.89%
  • Jul 13: -5.67%

NASDAQ (since 1971)

  • Jun 30: +73.30%
  • Jul 1: +63.18%
  • Jul 2: -47.43%
  • Jul 3: +46.02%
  • Jul 4: +0.00% (market closed – holiday)
  • Jul 5: +7.04%
  • Jul 6: -10.79%
  • Jul 7: +60.19%
  • Jul 8: -10.10%
  • Jul 9: +86.44%
  • Jul 10: -27.94%
  • Jul 11: +11.18%
  • Jul 12: +128.28%
  • Jul 13: +61.52%

Russell 2000 (since 1987)

  • Jun 30: +99.14%
  • Jul 1: +30.53%
  • Jul 2: -113.05%
  • Jul 3: +44.57%
  • Jul 4: +0.00% (market closed – holiday)
  • Jul 5: -4.89%
  • Jul 6: -76.61%
  • Jul 7: +43.95%
  • Jul 8: +37.24%
  • Jul 9: +31.88%
  • Jul 10: -17.39%
  • Jul 11: +29.75%
  • Jul 12: +89.15%
  • Jul 13: +63.13%

The S&P 500 data dates back to 1950, while the NASDAQ and Russell 2000 information date back to 1971 and 1987, respectively.

Final Thoughts

All-time highs are always a time for me to say “I told you so” to the bears, since I’ve been a firm believer that we remain in a secular bull market advance – one in which we should EXPECT to see higher prices and all-time highs. This latest rally is being fully supported by risk-on areas of the market, which will almost certainly lead for more and more all-time highs down the road.

Here are several things I’m watching this week:

  • Jobs. The ADP employment report will be out on Wednesday and the more-closely-watched nonfarm payrolls will be released on Thursday this week since the stock market is closed on Friday. ANY sign of weakness in these reports will begin to put mounting pressure on the Fed to cut rates in late July at their next meeting.
  • Technical Price Action. Any time we’re setting new all-time highs, I start off with a bullish mindset. I only turn bearish if I’m inundated with warning signals. Currently, I see few of those.
  • History. We can now turn our attention to upcoming earnings season and, historically, that’s a bullish thing. Pre-earnings season runs to the upside are common and, if you scroll up and check out historical returns for days over the next couple weeks, you’ll see that July normally performs well – especially the first half of the month.
  • 10-Year Treasury Yield ($TNX). The 10-year treasury yield has been in decline for 3 straight weeks, falling from 4.52% on June 9th to 4.24% just a few minutes ago. The money rotating into bonds is a very strong signal that inflation is NOT a problem. It’s also a signal that the Fed “should be” considering a rate cut at its next meeting.
  • Breakouts. We’ve seen big breakouts in key areas like semiconductors ($DJUSSC), software ($DJUSSW), and investment services ($DJUSSB), but there will be plenty more. Travel & tourism ($DJUSTT) joined the party on Thursday. Banks ($DJUSBK) are on the verge of a breakout. The way I look at it? The more the merrier!

Happy trading!

Tom

Mali’s military-led government has completed its takeover of the Yatela and Morila gold mines.

Reuters reported on Monday (June 30) that according to the Malian government, control of the Yatela mine in Western Kayes and the Morila mine in Southern Sikasso has officially been transferred to the Society for Research and Exploitation of Mineral Resources of Mali (SEMOS), a newly formed entity in the country.

The Yatela mine was abandoned in 2016 by Sadiola Exploration Company — a joint venture between South Africa’s AngloGold Ashanti (NYSE:AU,JSE:ANG) and Canada’s IAMGOLD (TSX:IMG,NYSE:IAG) — after the operators deemed continued production uneconomic despite leftover reserves.

Morila, once one of Mali’s flagship gold sites, was abandoned in 2022 by Australia’s Firefinch, which had taken over the site from Barrick Mining (TSX:ABX,NYSE:B) and AngloGold. Mali’s government says Morila was left with “significant environmental and financial liabilities,” raising concerns about whether SEMOS can turn operations around profitably.

These moves are part of a broader push by Mali’s military government, which came to power after coups in 2020 and 2021, to restructure the gold sector and capture more revenue from high commodities prices.

Mali produces around 65 metric tons of gold annually, making it Africa’s second largest producer, yet it lacks an internationally certified refinery and is heavily dependent on foreign operators for both technology and market access.

Earlier this year, Business Insider Africa reported that the country had started construction on a Russia-backed gold refinery, another step meant to increase control over its natural resources.

Since taking power, Mali’s authorities have steadily pressured miners via higher taxes, tougher licensing conditions and new contract terms aligned with its 2023 mining code, which grants the state a bigger stake in operations.

Yet critics caution that simply taking over mines without clear management plans or technical expertise risks undercutting investor confidence and missing out on today’s high gold price.

Gold is up 28.5 percent year-to-date, hitting an all-time high of US$3,500 per ounce in April, driven by geopolitical fears and US President Donald Trump’s aggressive tariff policy.

Mali’s ongoing dispute with Barrick Mining

Mali’s relationship with Barrick has soured amid the country’s move to exert resource sector control.

Earlier this month, a commercial court in Bamako ordered the temporary transfer of control of Barrick’s flagship Loulo-Gounkoto gold complex to a state-appointed administrator for six months.

Judge Issa Aguibou Diallo appointed Soumana Makadji, a former health minister and certified accountant, to oversee the complex, participate in negotiations and report to the court quarterly, but not to the government directly.

Barrick called the move “unjustified” and “unprecedented,” maintaining that it remains committed to previous mining conventions and that the Malian government’s push to apply the 2023 mining code retroactively is legally invalid.

Barrick’s Loulo-Gounkoto complex, among the most productive gold mines in Africa, has been inactive since January after Malian authorities seized roughly 3 metric tons of gold over disputed taxes.

Since November 2024, the government has also blocked gold exports from the site, escalating tensions as the gold rally has boosted Mali’s hopes for greater revenue.

The government insists that Barrick must comply with its revised mining framework. Barrick, on the other hand, has started international arbitration to protect its long-term agreements.

Securities Disclosure: I, Giann Liguid, hold no direct investment interest in any company mentioned in this article.

This post appeared first on investingnews.com

Uranium market watchers know that Canada’s Athabasca Basin is among the world’s richest uranium jurisdictions and hosts several of the highest-grade uranium deposits on the planet.

Spanning close to 100,000 square kilometers of the Canadian Shield of Northern Saskatchewan and Alberta, the Athabasca Basin is a major contributor to Canada’s status as the second largest uranium producer and the third largest country by uranium reserves.

Unsurprisingly, the region is home to the world’s largest uranium mine, Cigar Lake. The mine reports average grades of 14.69 percent U3O8 and accounts for 14 percent of global uranium production.

First commissioned in 2014, Cigar Lake is operated by uranium major Cameco (TSX:CCO,NYSE:CCJ), which holds a 54.547 percent stake in the mine, as part of a joint venture with Orano Canada at 40.453 percent and TEPCO Resources at 5 percent. Ore from the underground mine property is processed at Orano’s McClean Lake mill, located 70 kilometers from the mine.

Uranium was first discovered in the Athabasca Basin in 1934, and today the region remains a major hot spot for uranium exploration. In recent years, a number of Athabasca Basin uranium companies have made exciting new discoveries, sparking a staking rush by others looking to get in on the action.

Athabasca Basin uranium exploration companies

1. ATHA Energy (TSXV:SASK,OTCQB:SASKF)

ATHA Energy has an extensive uranium exploration pipeline across Canada, including in Saskatchewan’s Athabasca Basin. At 3.8 million acres, ATHA’s land package in the Athabasca Basin includes the Gemini project, a basement-hosted near-surface uranium deposit with uranium intercepts of between 6,190 and 96,600 parts per million.

The company also holds a 10 percent carried interest in exploration projects operated by NexGen Energy (TSX:NXE,NYSE:NXE) and IsoEnergy (TSX:ISO).

2. Azincourt Energy (TSXV:AAZ,OTCQB:AZURF)

Azincourt Energy has two uranium projects in Canada, one of which is its East Preston joint venture project near the southern edge of the Western Athabasca Basin. Azincourt has an 86.5 percent interest, with the remainder held by Skyharbour Resources. The 20,647 hectare property is adjacent to Skyharbour’s minority-owned Preston project.

Azincourt says it is targeting basement-hosted unconformity-related uranium deposits in two prospective conductive, low-magnetic-signature corridors. The company is planning for a fall 2025 geophysics exploration program at East Preston in preparation for a potential winter 2026 diamond drill program.

3. Baselode Energy (TSXV:FIND)

Baselode Energy’s strategy is developing assets near the Athabasca Basin with similar geology. Its ACKIO near-surface uranium discovery at its Hook project is located directly adjacent to the Athabascan Basin. First discovered by the company in September 2021, the ACKIO near-surface uranium prospect is more than 375 meters along strike, and more than 150 meters wide.

Baselode has identified at least nine separate uranium pods, or small bodies of mineralization, on the project. Drill results from its summer 2024 exploration program were released in May 2025, demonstrating the potential for further expansion of the known uranium mineralization at ACKIO.

4. CanAlaska Uranium (TSXV:CVV)

CanAlaska Uranium is a project generator with interests in a portfolio of assets in the Athabasca Basin covering 1.24 million acres. The company is advancing its West McArthur joint venture with Cameco, which is situated near the McArthur River mine in the Eastern Athabasca Basin. CanAlaska owns 85 percent of the project.

CanAlaska’s 2025 C$12.5 million drill program at West McArthur is aimed at expanding and delineating the high-grade Pike Zone uranium discovery.

Earlier this year, the company completed the first drilling in over 10 years at its wholly owned Cree East deposit in the south-eastern portion of the Basin. The drill program was fully funded by Nexus Uranium (CSE:NEXU,OTCQB:GIDMF) as part of an option earn-in agreement to earn up to 75 percent interest in the project.

5. Denison Mines (TSX:DML)

Uranium miner Denison Mines’ direct ownership interests in the Athabasca Basin region covers approximately 384,000 hectares. The company has a 22.25 percent stake in the McClean Lake mine and mill joint venture project operated by Orano Canada.

Denison’s flagship project in the region is Wheeler River, considered the largest undeveloped uranium project in the eastern region of the Athabasca Basin. Wheeler River hosts the high-grade Phoenix and Gryphon deposits.

According to a 2023 feasibility study, Phoenix hosts a proven and probable resource of 219,000 metric tons at an average grade of 11.7 percent uranium for 53.3 million pounds. The company plans to develop the deposit as an in-situ recovery operation.

The Canadian Nuclear Safety Commission is slated to conduct hearings for the project’s environmental assessment and license on October 8 and December 8 to 12, 2025. If approval is granted, the company is looking to break ground in early 2026 and commence production by the first half of 2028.

As for the Gryphon deposit, Denison has evaluated it as a conventional mine in a pre-feasibility study. The company conducted a field program in the first quarter 2025 that may be used for a future feasibility study.

6. F3 Uranium (TSXV:FUU,OTCQB:FUUFF)

F3 Uranium has three exploration properties in the western region of the Athabasca Basin: the advanced-stage Patterson Lake North project, which hosts the JR discovery, as well as the early-stage Minto and Broach projects.

In February 2025, the company launched a drill campaign at its Patterson Lake North project followed by ground geophysical exploration programs at its Broach and Minto projects. F3 Uranium raised C$7 million in flow-through shares in May 2025, which will go towards further exploration of its uranium projects.

7. Forum Energy Metals (TSXV:FMC,OTCQB:FDCFF)

Forum Energy Metals has numerous wholly owned and joint venture projects hosting new discoveries of high-grade unconformity-related uranium deposits in the Athabasca Basin. So far in 2025, the company’s focus has been on the Northwest Athabasca (NWA) project, a joint venture between Forum at 45.4 percent, NexGen Energy at 25.3 percent, Cameco at 18 percent and Orano Canada at 11.3 percent.

Early in the year, Forum announced an option agreement allowing Global Uranium (CSE:GURN,OTCQB:GURFF) to earn up to 75 percent of Forum’s stake in the property by spending C$20 million in exploration expenditures at NWA.

In April, Global Uranium completed a diamond drilling program and ground geophysical surveys on the project, which intersected elevated radioactivity and alteration systems distinct to unconformity-type uranium mineralization.

8. IsoEnergy (TSX:ISO)

IsoEnergy has a portfolio of projects and joint ventures in the Eastern Athabasca Basin, and its main focus is the Hurricane deposit at its wholly owned Larocque East uranium property.

The company discovered Hurricane in 2018 and it now stands as the world’s highest-grade indicated resource of uranium. A 2022 resource estimate reported an indicated high-grade resource of 63,800 metric tons grading 34.5 percent uranium for 48.61 million pounds of contained uranium.

IsoEnergy’s summer exploration program will include drilling to test potential resource expansion at Larocque East as well as exploration at its other Athabasca Basin projects.

9. NexGen Energy (TSX:NXE,NYSE:NXE)

NexGen is another uranium mining company with a large land package in the basin, including its development-stage Rook I project.

Rook I has a measured and indicated resource estimate of 256.7 million pounds contained uranium from ore grading an average of 3.1 percent U3O8. The 2021 feasibility study outlines an 11.5 year initial mine life with up to 29.2 million pounds of U3O8 production per year for the first five years.

The Federal Environmental Impact Statement for Rook I was accepted in January 2025, and the Canadian Nuclear Safety Commission has proposed hearing dates for the project on November 19, 2025, and February 9 to 13, 2026. NexGen plans to immediately begin construction activities following final federal approval.

10.Paladin Energy (TSX:PDN)

Paladin Energy’s Patterson Lake South (PLS) project hosts the large, high-grade and near-surface Triple R deposit, which has the potential to produce both uranium and gold. The company acquired it as part of its acquisition of Fission Uranium in 2024. Paladin also holds six early-stage uranium projects in the basin.

PLS’s mineral reserve estimate includes probable reserves of 93.7 million pounds from 3 million metric tons of ore at an average grade of 1.41 percent U3O8. The 2023 feasibility study demonstrates life of mine production of approximately 9 million pounds U3O8 per year over a 10 year mine life.

The company released positive drill results from its winter drill program on the Saloon East zone in June 2025 showing the potential to further grow the resource base of the property outside of the Triple R deposit. The project is advancing through the environmental permitting process.

11. Purepoint Uranium (TSXV:PTU)

Purepoint Uranium has an extensive uranium portfolio, including six joint ventures and five wholly owned projects all located in the Athabasca Basin.

Purepoint has a significant joint venture relationship with IsoEnergy (TSX:ISO) that includes a 50/50 joint venture agreement to explore 10 uranium projects across 98,000 hectares in the eastern portion of the Athabasca Basin. The partners launched a 2025 drill campaign in May at the Dorado project, which will include approximately 5,400 meters across 18 holes, targeting high-priority electromagnetic conductors for uranium mineralization.

Its joint ventures also include the Hook Lake uranium project in the Patterson region, in which it owns a 21 percent interest alongside Cameco and Orano Canada, which both hold 39.5 percent.

12. Skyharbour Resources (TSXV:SYH,OTCQX:SYHBF)

Skyharbour Resources is another junior mining company with an extensive portfolio of uranium exploration projects in the Athabasca Basin, comprising 36 uranium projects over 614,000 hectares. The company’s core projects include its 57.7 percent owned Russell Lake project — a joint venture with Rio Tinto (ASX:RIO,NYSE:RIO,LSE:RIO) — and its wholly owned Moore project.

Skyharbour’s 49,635 hectare Preston uranium project in the western portion of the Athabasca Basin is the subject of a 7,000 meter 2025 summer drill campaign being conducted by its joint venture partner, Orano Canada. Orano is the majority owner and operator at the project at 53.4 percent, while Skyharbour owns a minority interest of approximately 25.6 percent. The remainder is held by Dixie Gold.

13. Standard Uranium (TSXV:STND,OTCQB:STTDF)

Standard Uranium is an emerging project generator that holds interest in over 94,476 hectares in the Athabasca Basin, including its flagship Davidson River project in the southwest region of the basin.

In spring 2025, Standard Uranium partnered with Fleet Space Technologies Canada on three ExoSphere Multiphysics survey grids across the Warrior, Bronco and Thunderbird conductors at Davidson River. The surveys will provide important data for upgrading drill targets across the property through imaging of density anomalies in the basement rock.

Securities Disclosure: I, Melissa Pistilli, hold no direct investment interest in any company mentioned in this article.

This post appeared first on investingnews.com

Here’s a quick recap of the crypto landscape for Monday (June 30) as of 9:00 p.m. UTC.

Get the latest insights on Bitcoin, Ethereum and altcoins, along with a round-up of key cryptocurrency market news.

Bitcoin and Ethereum price update

Bitcoin (BTC) is priced at US$107,538, up 0.2 percent in the last 24 hours. The day’s range for the cryptocurrency brought a low of US$106,831 and a high of US$107,802 at the opening bell.

Bitcoin price performance, June 27, 2025.

Chart via TradingView.

Ethereum (ETH) closed at US$2,510.38, up by 3.1 percent over the past 24 hours and its highest valuation of the day. Its lowest valuation on Monday was US$2,443.56.

Altcoin price update

  • Solana (SOL) was priced at US$156.95, up by 4.1 percent over 24 hours. Its highest valuation as of Monday was US$158.34, and its lowest was US$150.53.
  • XRP was trading for US$2.29, up by 5.5 percent in 24 hours and its highest valuation on Monday. The cryptocurrency’s lowest valuation was US$2.17.
  • Sui (SUI) is trading at US$2.82, showing an increaseof 0.5 percent over the past 24 hours. Its lowest valuation was US$2.75, and its highest valuation was US$2.83.
  • Cardano (ADA) is priced at US$0.5829, up by 4.8 percent in the last 24 hours and its highest valuation of the day. Its lowest valuation on Monday was US$0.5589.

Today’s crypto news to know

REX to launch Solana staking ETF this week

The REX-Osprey Solana and Staking ETF is set to launch on Wednesday (July 2), as confirmed by issuer REX Shares on Monday. Analysts had predicted this news was imminent just days before its release.

This fund, the first US-staked cryptocurrency ETF, will enable investors to hold Solana and generate yield through staking, potentially fostering wider institutional adoption of cryptocurrency.

REX’s launch comes after thoughtful consideration by the US Securities and Exchange Commission. The commission had previously asserted that the company’s unique C-Corp business structure could be in conflict with Rule 6c-11 under the Investment Company Act of 1940, which governs how ETFs operate and are regulated. REX updated its prospectus with positive feedback, securing regulatory approval for the fund.

OSL soars after buying Canadian crypto firm Banxa

OSL Group (HKEX:0863), a Hong Kong-listed digital asset platform, saw its shares spike 10 percent after announcing it had acquired Canadian crypto payments firm Banxa. The acquisition supports OSL’s ambitious global expansion strategy, which includes applying for stablecoin licenses as new regulatory frameworks emerge.

Finance Chief Ivan Wong explained that acquiring Banxa would enhance OSL’s cross-border payments capabilities and boost its role in the growing stablecoin market.

Hong Kong’s stablecoin bill, set to take effect on August 1, is a major catalyst for this expansion, with Chinese giants already showing interest. OSL is already licensed in Australia, with deals in Japan, Europe and Indonesia soon to close. The company aims to be a key stablecoin issuer in Asia and beyond.

Metaplanet strengthens Bitcoin treasury with fresh bond issuance

Tokyo-based Metaplanet (OTCQX:MTPLF,TSE:3350) has added another 1,005 BTC to its corporate treasury, pushing its total holdings to 13,350 BTC. To further build its crypto war chest, the company announced a zero-interest bond issuance worth US$208 million, designed to finance additional Bitcoin purchases.

Metaplanet is well known for its aggressive Bitcoin strategy, which has made it one of the world’s largest corporate holders of the cryptocurrency. Just last week, the hotel and investment firm raised US$515 million through an equity issuance to support its Bitcoin ambitions.

At current market prices around, Metaplanet’s Bitcoin stash is worth well over US$1.4 billion.

The Blockchain Group expands Bitcoin holdings and capital pool

Paris-based the Blockchain Group has further strengthened its Bitcoin treasury with the purchase of 60 BTC for around 5.5 million euros, boosting its holdings to 1,788 BTC.

The firm also raised about 600,000 euros by exercising warrants, allowing it to buy an additional 6 BTC.

Blockstream CEO Adam Back invested in the firm’s share offering, subscribing to over 2.1 million new shares, while French asset manager TOBAM contributed nearly 143,000 euros, supporting the purchase of 13 more BTC.

The company conducted an “ATM-type” capital increase with TOBAM, raising 4.1 million euros to fund 41 BTC.

Altogether, the Blockchain Group has secured a BTC yield of roughly 1,270 percent so far this year, with gains amounting to about 46.7 million euros.

Backed Finance launches tokenized stock product

Backed Finance, a company focused on bridging traditional financial assets like stocks and ETFs onto blockchain through tokenization, announced the launch of its tokenized stocks product, xStocks, on Monday.

60 stocks are now accessible on Bybit, Kraken and several Solana DeFi protocols, providing users with exposure to traditional stocks through blockchain infrastructure.

‘xStocks represent a monumental leap forward in democratizing access to financial markets,’ said Adam Levi, co-founder of Backed, in a press release. ‘By bringing familiar assets onto the blockchain with unprecedented accessibility, we are not just bridging traditional finance and DeFi; we are building the foundational blocks for a truly open, efficient, and inclusive global financial system where everyone can participate in wealth creation.’

Chainlink rolls out Automated Compliance Engine

Chainlink announced an early access rollout of its Automated Compliance Engine on Monday.

Built on the Chainlink Runtime Environment and launched in collaboration with Apex Group, GLEIF and ERC-3643 Association, the system automates the process of checking and enforcing financial rules for both traditional and blockchain-based financial activities, making it easier for established financial institutions to use new blockchain technologies in a compliant and safe way.

Topnotch Crypto launches adaptive yield contracts

Topnotch Crypto has launched its new adaptive yield contracts, which the company says are aimed at helping crypto investors maintain returns despite ongoing market volatility.

The contracts use proprietary predictive yield-switching artificial intelligence to automatically rotate customer funds between cloud mining and staking, depending on which is more profitable in real time.

The company’s strategy analyzes a range of on-chain data, from network congestion to staking rates, to continuously optimize yields. Unlike many passive strategies, the adaptive yield approach gives investors exposure to multiple cryptocurrencies to spread out risk. Another highlight is Topnotch’s use of geothermal and solar energy, which helps keep costs down while supporting sustainability goals.

Securities Disclosure: I, Giann Liguid, hold no direct investment interest in any company mentioned in this article.

Securities Disclosure: I, Meagen Seatter, hold no direct investment interest in any company mentioned in this article.

This post appeared first on investingnews.com

More than 40 people have been killed in an Israeli airstrike that hit a cafe near the port in Gaza City, according to the head of the territory’s largest hospital.

Dr. Mohammad Abu Silmiya, the director of Al-Shifa hospital, said in an update on Monday night that at least 41 people had been killed and 75 injured in the strike.

The Al-Baqa cafe was a well-known spot for students, journalists and remote workers, as it offered internet and a place to work by the Mediterranean coast.

He also said the hospital was short of ICU beds and anesthetics to treat the casualties. The death toll increased Monday night after some people died from their injuries.

“We are treating the injured on the hospital floor as no rooms and hospital beds are available,” the hospital director added.

Among those killed was a freelance journalist, Ismail Abu Hatab, according to other journalists at the scene.

The Hamas-controlled Government Media Office said his death brought to 228 the number of journalists killed by Israeli military action in Gaza since October 2023.

This post appeared first on cnn.com

The British Royal Household released its financial statement on Monday, revealing that the annual lump sum from the government remained at £86.3 million ($118.50 million).

The sum, called the Sovereign Grant, pays for the upkeep of royal palaces and the royals’ official duties and is funded by British taxpayer money. In return, the monarch hands over all profits from the Crown Estate — which includes vast swathes of central London property, the Ascot Racecourse and the seabed around England, Wales and Northern Ireland — to the government, in an arrangement dating back to 1760.

The Sovereign Grant functions like an expense account for the monarch and their representatives, covering the costs of their public duties, including travel, staff, and upkeep of historic properties. Notably, it excludes funding for security, which also incurs a high cost given the royals’ numerous public engagements and events.

Royal family members undertook more than “1,900 public engagements in the UK and overseas, while more than 93,000 guests attended 828 events at Official Royal Palaces,” the annual Sovereign Grant Report said.

The total grant of £86.3 million ($118.50 million), which by law remains the same as the three previous financial years, is comprised of a £51.8 million ($71.1 million), core grant and £34.5 million ($47.4 million) to fund the refurbishment of Buckingham Palace.

Buckingham Palace, a top tourist attraction in central London, is undergoing a major modernization project that will see upgrades to electric cabling, pipework, elevators and accessible bathrooms.

The royal family will decommission the royal train “following a thorough review into its use and value for money,” according to the accounts report. The monarchy has been using its own rail travel since Queen Victoria first boarded a specially built carriage from Slough, England, to London Paddington Station in 1842.

The report also said the Royal Household will increase its use of sustainable aviation fuel (SAF) and continue the electrification of its fleet of vehicles.

Last year, the Royal Household announced it aimed to transition to an “almost fully electric” fleet of vehicles, without providing a target date. Britain’s PA Media reported that the King’s two Bentleys would be modified to run on biofuel.

The royal family’s three main sources of income are the Sovereign Grant, the Duchy of Lancaster and Duchy of Cornwall estates and their personal property and investments.

The level of funding for the British royal family has long fueled criticism, with one anti-monarchy group calling for the Sovereign Grant to be abolished and for the British public to keep all the profits of the Crown Estate.

“The grant system is mad. Funding goes up not because of any need for extra money, but because the grant is linked to government profits from land managed by the Crown Estate,” Graham Smith, a campaigner for the group Republic, said in a statement earlier this year. “The palace has recycled the excuse of needing the money for refurbishment of Buckingham Palace, an excuse used to double the grant ten years ago.”

“It’s time that half a billion pounds was put to good use, that there was proper accounting for the cost of the monarchy and for that cost to be slashed to just a few million pounds,” Smith added.

The Keeper of the Privy Purse, James Chalmers, said in a statement on Monday as the report was released: “Soft power is hard to measure but its value is, I believe, now firmly understood at home and abroad, as the core themes of the new reign have come into even sharper focus, and the Royal Family have continued in their service to the nation, Realms and Commonwealth.”

This post appeared first on cnn.com

Prosecutors in northern Mexico’s Sinaloa state are investigating the discovery of 20 male bodies with gunshot wounds – including five that were decapitated – on a bridge over a federal highway.

Sinaloa Secretary General Feliciano Castro Meléndez called the case a “regrettable situation” and said it was “part of the violence and insecurity that Sinaloa is experiencing.”

Since 2024, Culiacán has been the epicenter of armed clashes between rival factions of the Sinaloa cartel.

Two of the most prominent factions are La Mayiza, which is loyal to the cartel’s alleged co-founder Ismael “El Mayo” Zambada, and Los Chapitos, which is loyal to the sons of former drug kingpin Joaquín “El Chapo” Guzmán.

‘Los Chapitos’

The violence in Sinaloa escalated after Zambada and one of El Chapo’s sons, Joaquín Guzmán López, were arrested last year by US authorities in El Paso, Texas.

Former Mexican Secretary of Security Rosa Icela Rodriguez said Guzmán López had reached an agreement with one of his brothers, Ovidio Guzmán López, who is in US custody, “So that they would go to the United States to surrender.”

Ovidio had been extradited to the US in September 2023 to face drug trafficking charges over his alleged role in the Sinaloa cartel. Days after his extradition, he pleaded not guilty to the charges in a US court.

Later that month, several members of his family entered the US as part of an apparent “negotiation or plea deal opportunity provided by the (US) Department of Justice itself,” Mexico’s Security Secretary Omar García Harfuch said.

Two other sons of El Chapo, Ivan Archivaldo and Jesus Alfredo Guzmán Salazar, are still at large. The US has accused them of leading large-scale drug trafficking operations for the cartel and has issued $10 million bounties for information leading to each of their arrests.

This post appeared first on cnn.com