Archive

May 2025

Browsing

The Nigerian journalist has been accepted into Columbia Journalism School for a master’s degree and was on the cusp of applying for her US visa. “I don’t have any backup plan,” the 31-year-old said. “I put all my eggs in one basket – in Columbia… which is quite a risk.” She is due to start her degree in New York in August having already paid a hefty enrolment fee.

Akintade is among thousands of people across the globe who were thrown into limbo on Tuesday when the US State Department instructed its embassies and consulates to pause the scheduling of new student visa interviews as it plans to expand social media vetting for applicants.

It’s the latest in a series of moves by the Trump White House targeting higher education, starting with an ongoing fight with Harvard University and then dramatically expanding in scope.

‘A scary time to study in the US’

“It feels like a really scary and unsettling time for international students studying in the US,” said one Canadian student who has also been accepted by Columbia. “A lot of us chose to study in the US for its freedoms but now knowing that innocent social media posts could cost an education feels like censorship.”

“We were looking at a post from us at Pride, and my caption was simply a rainbow flag and then a trans flag. And I was on the phone with her ‘and I was like, do I have to take this down?’ Eventually we decided no, I could leave it up, but I changed the caption, I removed the trans flag. I don’t know how to feel about that,” the student said.

“I do think it’s real proof that it is a fear campaign that is incredibly successful,” she said, adding that she has deferred her place for this year after getting a job offer. “I changed the caption with the anticipation that it could get worse. Today it is one (issue) and tomorrow it will be another one.”

The State Department has required visa applicants to provide social media identifiers on immigrant and nonimmigrant visa application forms since 2019, a spokesperson said. In addition, it had already called for extra social media vetting of some applicants, largely related to alleged antisemitism. But it’s unclear what kind of post might pose a problem for an application from now on, or how these posts will be scrutinized.

British student Conrad Kunadu said he’d been grappling with an “internal conflict” over his offer to pursue a PhD in Environmental Health at Johns Hopkins University after monitoring the crackdown on US colleges “religiously” for the past few months.

After wondering whether he could manage his anxiety that “something (he) wrote in 2016” could get him deported, Kunadu decided to stay in Britain and study at Oxford University instead. Despite being grateful to have another option, he described his situation as a “lose-lose.”

“I wanted to study in the US not just because, for my interests in health security, it’s where all the talent and resources are, but because it’s the best way to make an impact on these issues at a global scale,” Kunadu said. Like many others, he can’t help but mourn the possible academic research and advances that now may never come to fruition.

Kunadu and another student who requested anonymity both mentioned being anxious about exploring topics in their studies that could be interpreted as dissent and ruffle official feathers.

Kagan described the visa halt as “one of many attacks on higher education and immigrants… two of the Trump administration’s favorite targets,” which in this case overlap. And while the directive is consistent with what the White House was already doing, he sees this as “an unprecedented attack in a non-emergency time.”

When asked whether those who had accepted college offers and were waiting for a visa appointment had any legal avenues available to them, Kagan was not encouraging. “If someone is trying to enter and not yet getting a visa, (that person) usually has nearly no recourse,” he said.

A sense of rejection

In the 2023-34 academic year, more than 1.1 million international students studied at US higher education institutions, according to a report from the the Institute of International Education.

For Nigerian journalist Akintade, who has always dreamed of studying at an Ivy League school, the feeling of rejection by the US is weighing heavily. “This is the message I’m getting: we don’t want you,” she said, with a deep sigh.

Lisa Klaassen, Nimi Princewill and Quinta Thomson contributed to this report

This post appeared first on cnn.com

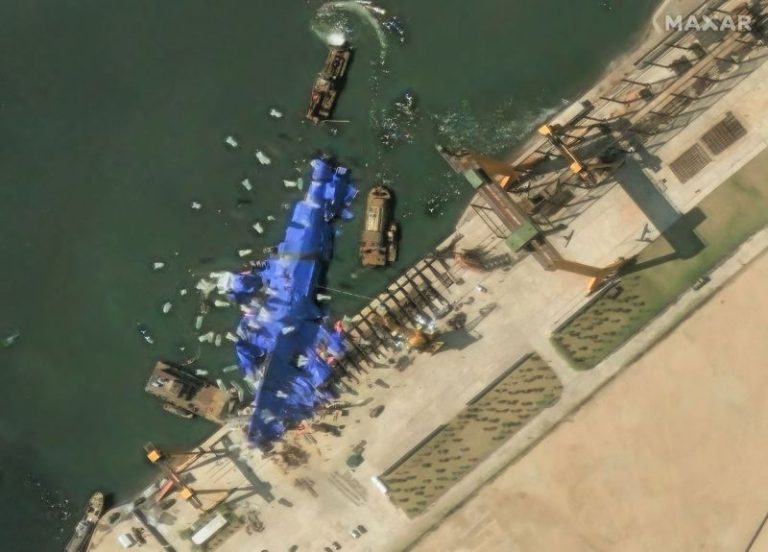
New satellite images show that North Korea has deployed what appear to be balloons alongside its damaged 5,000-ton warship that has been laying on its side and partially submerged since a botched launch last week.

The stricken destroyer was the country’s newest warship and was meant to be a triumph of North Korea’s ambitious naval modernization effort. Instead, a malfunction in the launch mechanism on May 21 caused the stern to slide prematurely into the water, crushing parts of the hull and leaving the bow stranded on the shipway, state media KCNA reported, in a rare admission of bad news.

North Korean leader Kim Jong Un, who witnessed the failed launch in the northeastern city of Chongjin, called it a “criminal act” and ordered the country to swiftly repair the as-yet-unnamed ship before the late-June plenary session of the ruling Workers’ Party, calling it a matter of national honor.

Officials have since scrambled to undo the damage and punish those they claim are responsible, detaining four people in recent days, including the shipyard’s chief engineer.

Analysts say it appears balloons are being used in North Korea’s effort to swiftly repair the destroyer.

“It looks like what appear to be balloons have been installed not to refloat the ship, but to prevent the ship from further flooding,” said Rep. Yu Yong-weon, a South Korean National Assembly lawmaker and military analyst.

Retired United States Navy Cpt. Carl Schuster said if the objects are indeed balloons, they could have one of two purposes – either to prevent “low- to mid-level drone reconnaissance,” or to reduce the stress on the part of the ship still stranded on the pier.

“That is the area that is most likely to have been damaged, suffered the most severe damage and remains under intense stress while the forward area remains out of the water,” he said.

Nick Childs, senior fellow for naval forces and maritime security at the International Institute for Strategic Studies, said North Korea could be in danger of further damaging the ship if it’s using balloons to keep it afloat or raise it.

“It is highly likely that the ship is under quite a lot of stress anyway,” and lifting from above could compound those stresses, he said.

Normal procedure would be to get as much buoyancy as possible in the ship and then raise it from below, Childs said.

According to satellite images shared by Maxar Technologies, more than a dozen white, balloon-like objects have been deployed around the destroyer since May 23.

The images don’t appear to show any flotation bladders supporting the hull or the body of the ship, Schuster said – something the US might use in such a situation. He added that North Korea’s maritime industry might not be advanced enough for such techniques.

North Korean state media had previously reported that the damage was less severe than initially feared, and that there were no holes in the hull, though it was scratched along the side and some seawater had entered the stern. It estimated repairs could take about 10 days – though analysts are skeptical.

The ship’s precarious position also makes the salvage operation unusually complex. “Having it half in and half out of the water is basically the worst possible situation,” said Decker Eveleth, an associate research analyst at CNA, a nonprofit specializing in defense research.

He added that the operation would be simpler if the ship had fully capsized into the water, or if it had fallen over entirely on land. “But as it’s half on land and half on water – if you try to pull the sunken half out, you’re risking twisting and breaking the keel,” Eveleth said, referring to the structural spine running along the ship’s bottom. “And if you do that, the whole ship is junk.”

Childs said North Korea may have to cut the ship into pieces and then try to salvage what it can because righting it from its current position is an extremely complex task.

“Very often the only way you clear the dock … is to dismantle at least part of the ship to make the operation easier, right what you have left and tow it away and make a decision on whether you rebuild it or scrap it,” he said.

This post appeared first on cnn.com

SIL Silver Miners

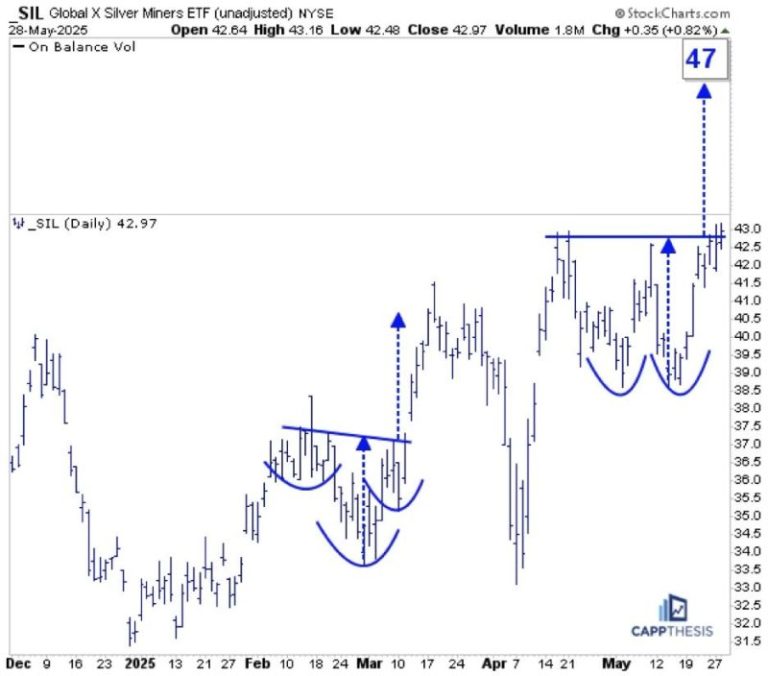
SIL was among the leaders yesterday and now is close to triggering this double-bottom bullish pattern. Staying above the 43-mark would target 47. That’s not a big move, but let’s remember that SIL is sporting bullish formations on its longer-term charts, too.

FIGURE 1. DAILY CHART OF GLOBAL X SILVER MINERS ETF (SIL).

SIL – Weekly

Firstly, the double-bottom pattern on this weekly log chart annotated in blue remains alive. This objective is up near 49.

Secondly, the area highlighted in green here is the same pattern pictured on the daily chart above. That area is sitting at the very top of a much bigger bullish inverse head-and-shoulders pattern that extends all the way back to 2021. Thus, if the short-term breakout works, it will trigger this one, as well. That target is in the mid-70s…

FIGURE 2. WEEKLY CHART OF GLOBAL X SILVER MINERS ETF (SIL).

SIL – Monthly

And that green pattern above is part of this MUCH larger, 13-year potential double bottom. We still have a while to go before this one is triggered, but it’s important to keep all of these in the back of our minds.

Anyone who trades or tracks SIL knows that short-term whipsaws are the norm. So, while these breakouts may not be clean, the bullish structures are clear. The bottom line is that if SIL continues to make higher highs and higher lows, the patterns will continue to work.

FIGURE 3. MONTHLY CHART OF GLOBAL X SILVER MINERS ETF (SIL).

USO Crude Oil

USO was among the leaders yesterday, but it’s still trying to bust through its 50-DMA, which has been the sticking point the last few weeks. If it can soon, USO could complete this potential bullish inverse H&S pattern. The upside target would be in the 77-78 range, and that would align with key short-term tops from the last year. First step, push above the 50-day line…

FIGURE 4. DAILY CHART OF US OIL FUND (USO).

NVDA

The obvious question every time NVDA rallies is whether it’s too late to buy.  To get a true sense of the stock’s technical prospects, we need to view it across different charts and time frames.

First, here’s a view of the bullish flag pattern we cited on Tuesday (along with TSLA, GOOGL and META). Given the preceding staircase-like advance, the starting point of the flagpole is subjective. We’re using the early May low given that the stock avoided filling a gap from a few days earlier.

Regardless, the measured move counts to the 161 zone, which would be a new all-time high.

FIGURE 5. DAILY CHART OF NVIDIA CORP. (NVDA).

This second one is a daily chart that extends all the way back to 2010 and shows times when breaking below or above the 200-DMA led to strong, extended moves for the stock. From this angle, the recent 200-day breach didn’t last that long at all, and now NVDA has the chance to once again follow through after breaking back above it over the last few weeks.

FIGURE 6. LONGER-TERM DAILY CHART OF NVIDIA CORP. (NVDA).

Here’s a weekly, log chart going back to the 2022 low. NVDA has leveraged three major pattern breakouts since then to power the astounding rally the last two-plus years. With the stock last having made a new high last October and being net flat since last July, an eventual push back above the 150-zone could prompt big pattern-breakout number four.

FIGURE 7. WEEKLY CHART OF NVIDIA CORP. (NVDA).

Lastly, here are the biggest breakouts on this monthly chart that goes back over two decades. Again, looking at it from this viewpoint makes the last 11 months appear like a very small digestive phase, especially compared to the other three on the chart. Thus, the first step will be seeing how well NVDA can hold the opening gap. That’s important for today, but much more important for the days and weeks to come.

FIGURE 8. MONTHLY CHART OF NVIDIA CORP. (NVDA).

Nuclear energy stocks are on a tear, and Oklo Inc. (OKLO), Cameco Corp. (CCJ), and NuScale Power Corporation (SMR) are leading the charge, fueled by presidential executive orders, investor hype, and hopes for a nuclear-powered future.

Is It Time to Go Nuclear?

These names bucked the trend on Wednesday, rising even as the major U.S. indexes fell. I found all three while running a P&F Double Top Breakout scan, with SMR also appearing in the New 52-Week Highs scan. But are these gains a sign of genuine investment opportunities, or is this high-risk subsector just radioactive for your portfolio? To analyze this, let’s break down their profiles and charts to see whether the “glow” here points to real promise—or simply masks a toxic risk.

Here’s a PerfCharts snapshot of all three stocks against the SPDR S&P 500 ETF (SPY), our broader market proxy.

FIGURE 1. PERFCHARTS OF SMR, OKLO, CCJ, AND SPY.

While CCJ steadily lagged behind the S&P 500 until this month, both OKLO and SMR began outperforming the broader market starting in mid-October of last year. Their relative performance to date is so strong that it appears almost unsustainable in the short term.

All three mid-cap stocks are also showing robust StockCharts Technical Rank (SCTR) scores—OKLO at 99.6, SMR at 99.3, and CCJ at 89.9 at the time of writing. While this can indicate technical strength, it can also signal irrational exuberance among retail investors.

Robust SCTR Scores but Divergent Fundamentals

Another thing to note is the notable difference in their fundamentals. SMR and OKLO have negative P/E ratios, suggesting that their surges are driven more by promise and speculation than by profits. CCJ, with a P/E ratio of 149, is raking in some profits, but may also be riding an overcrowded wave of hype.

Ultimately, while technical performance can sometimes lead to fundamental strength—or mask fundamental weakness—it’s worth taking a closer look at these leading names in the nuclear subsector to understand the opportunities and risks they present. Let’s break it down further by examining each stock’s technical picture and what it suggests about investor conviction.

OKLO: Testing Highs, Buying the Dip?

To start, here’s a daily chart of nuclear energy startup OKLO.

FIGURE 2. DAILY CHART OF OKLO. In contrast to the other two nuclear stocks, OKLO is potentially experiencing higher levels of accumulation.

OKLO recently tested its all-time high of $59 before pulling back. The Relative Strength Index (RSI) shows the stock was deep within overbought territory, hinting at caution. Still, what’s interesting is that OKLO’s Accumulation/Distribution Line (ADL), plotted behind the price, remains strong. This suggests that even as the price retreats, buying pressure may still be present—hinting that investors might be looking to buy the dip rather than “sell the news.”

The key thing to watch now is how deep this retracement goes. If investors are still optimistic about OKLO’s fundamental outlook, you might see a bounce within the first two quadrants marked by the Quadrant Lines on the chart. Pay particular attention to the critical support range around the center line at $38, shown in the yellow-shaded area. If the price falls below this level, it could be a sign of weakness, suggesting the stock is more of a FOMO-driven trade than one backed by long-term conviction.

SMR: Hype or Healthy Pullback?

Next, we’ll shift over to a daily chart of SMR. Among the three, SMR is the only to notch a new all-time high. But does this signal the beginning of a new leg up, or the end of a surge that lacks substance?

FIGURE 3. DAILY CHART OF SMR. What happens next will show whether investors truly believe in the stock—or if the rally was driven by short-term hype.

SMR immediately declined after making a parabolic move to a new all-time high. As the RSI confirms, the stock was well-overbought. Now, it’s a matter of measuring the depth of the pullback.

I plotted a Fibonacci Retracement to highlight potential support levels. There are several zones of support from previous swing highs and a concentrated trading area between the 61.8% and 38.2% retracement levels. If investor confidence stays strong, expect a possible bounce between $21 and $24, marking the 61.8% and 50% Fib levels respectively. A deeper drop below the 61.8% level might still find support around $15, but that would also suggest that the rally was driven more by sentiment than strategic conviction.

CCJ: Underperforming Stock, Profitable Company

Lastly, let’s take a look at the most earnings-positive company among the three. Here’s a daily chart of CCJ.

FIGURE 4. DAILY CHART OF CCJ. The critical level to watch is the range between $50 – $52.

CCJ has a similar technical profile to OKLO and SMR—it’s overbought, and it tested its all-time high on a parabolic surge, leading to a pullback.

However, instead of measuring the various degrees of its potential retracements (using Fib or Quadrants), I’m focusing on the key range of $50–$52. Why? Because, in addition to marking a broad level that has acted as both support and resistance since October of last year, this range also shows a high concentration of trading activity, as indicated by the Volume-by-Price indicator.

If longer-term conviction holds, CCJ should bounce at this level. If not, expect the stock to decline further—although it may eventually find support at lower levels, it likely wouldn’t be worth chasing at that point.

At the Close

Nuclear energy stocks like OKLO, SMR, and CCJ have captured market attention, defying broader trends and flashing bullish technical patterns. But while momentum and investor enthusiasm are driving these moves, each stock also faces questions about sustainability and fundamentals.

Are we looking at a healthy dip—or is Wall Street just selling the news? To answer that question, keep an eye on the key technical levels outlined above. With these standout names in an emerging (and therefore highly uncertain) subsector, the technicals will likely reveal whether the market’s leaning toward conviction or just chasing the hype.


Disclaimer: This blog is for educational purposes only and should not be construed as financial advice. The ideas and strategies should never be used without first assessing your personal and financial situation, or without consulting a financial professional.

Nuvau Minerals Inc. (TSXV: NMC) (‘ Nuvau ‘ or the ‘ Company ‘) is pleased to announce that it has granted an aggregate of 2,430,000 stock options of the Company (‘ Options ‘) in two tranches to certain directors, officers and employees of the Company.

The first tranche consists of 1,500,000 Options (the ‘ Tranche 1 Options ‘) with each Tranche 1 Option entitling the holder to acquire one common share at an exercise price of $0.90 per common share until May 29, 2030 . The Tranche 1 Options are subject to vesting provisions, with 50% of the Tranche 1 Options vesting immediately and the remaining Tranche 1 Options vesting on December 12, 2025 .

The second tranche consists of 930,000 Options (the ‘ Tranche 2 Options ‘) with each Tranche 2 Option entitling the holder to acquire one common share at an exercise price of $0.47 per common share until May 29, 2030 .

About Nuvau Minerals Inc.

Nuvau is a Canadian mining company focused on the Abitibi Region of Québec. Nuvau’s principal asset is the Matagami Property that is host to significant existing processing infrastructure and multiple mineral deposits and is being acquired from Glencore.

For more information go to our website www.nuvauminerals.com .

Neither the TSX Venture Exchange nor its Regulation Services Provider (as that term is defined in the policies of the TSX Venture Exchange) accepts responsibility for the adequacy or accuracy of this news release. No stock exchange, securities commission or other regulatory authority has approved or disapproved the information contained herein.

Disclaimer & Forward-Looking Statements

This news release contains forward-looking statements and forward-looking information (collectively, ‘ forward-looking statements ‘) within the meaning of applicable securities laws. Any statements that are contained in this news release that are not statements of historical fact may be deemed to be forward-looking statements. Forward-looking statements are often identified by terms such as ‘may’, ‘should’, ‘anticipate’, ‘will’, ‘estimates’, ‘believes’, ‘intends’ ‘expects’ and similar expressions which are intended to identify forward-looking statements. More particularly and without limitation, this news release contains forward-looking statements concerning the Options. Forward-looking statements are inherently uncertain, and the actual performance may be affected by a number of material factors, assumptions and expectations, many of which are beyond the control of the Company, including expectations and assumptions concerning the Company. Readers are cautioned that assumptions used in the preparation of any forward-looking statements may prove to be incorrect. Events or circumstances may cause actual results to differ materially from those predicted as a result of numerous known and unknown risks, uncertainties and other factors, many of which are beyond the control of the Company. Readers are further cautioned not to place undue reliance on any forward-looking statements, as such information, although considered reasonable by the management of the Company at the time of preparation, may prove to be incorrect and actual results may differ materially from those anticipated.

The forward-looking statements contained in this news release are made as of the date of this news release, and are expressly qualified by the foregoing cautionary statement. Except as expressly required by securities law, neither the Company nor Nuvau undertakes any obligation to update publicly or to revise any of the included forward-looking statements, whether as a result of new information, future events or otherwise.

SOURCE Nuvau Minerals Inc.

View original content to download multimedia: http://www.newswire.ca/en/releases/archive/May2025/29/c3082.html

News Provided by Canada Newswire via QuoteMedia

This post appeared first on investingnews.com

In 2025, the vanadium market is navigating a complex landscape shaped by its traditional role in steelmaking and its emerging importance in energy storage technologies.

Approximately 90 percent of vanadium consumption continues to be driven by the steel industry, where it is used to strengthen alloys. However, the growing adoption of vanadium redox flow batteries (VRFBs) for grid-scale energy storage is creating new avenues for demand, particularly as countries pursue decarbonization goals and renewable energy integration.

On the supply side, vanadium sees relatively limited primary production from ore and instead relies on co-production from steel slag and uranium mining, with a portion also coming from recycling. Global production has remained relatively consistent in the 2020s at around 100,000 metric tons per year.

Four countries contribute to the vast majority of that output. Below is a brief overview of these top vanadium-producing countries based on data from the US Geological Survey’s 2025 Mineral Commodity Summary.

1. China

Mine production: 70,000 metric tons

China remains the world’s top vanadium-producing country by far, with output of 70,000 metric tons in 2024. Production has remained steady out of China in 2023 and 2024. The Asian nation far outpaces all other countries in terms of vanadium output, and leads the world in vanadium consumption as well due to its high steel production. The majority of its vanadium is produced from steel slag.

In terms of vanadium exports, China’s are ‘quite small,’ according to Fastmarkets, as producers can turn a bigger profit in the domestic market.

2. Russia

Vanadium production: 21,000 metric tons

Second on the list is Russia, whose vanadium output totaled 21,000 metric tons in 2024, essentially on par with production in the previous two years. Russia’s vanadium reserves are the second largest in the world at 5,000 MT.

EVRAZ KGOK, part of EVRAZ, is a major mining company in Russia that produces vanadium. Little other information is available about vanadium mining in Russia, and the majority of the country’s vanadium production is a co-product of steel slag.

3. South Africa

Vanadium production: 8,000 metric tons

South Africa’s vanadium output declined last year, slipping to 8,000 metric tons in 2024, The country’s vanadium output had previously held above the 8,500 MT per year a level since 2019.

South Africa’s contributions to the vanadium market consist of primary production from Bushveld Minerals (LSE:BMN) and Glencore (LSE:GLEN,OTC Pink:GLCNF). Bushveld Minerals’ vanadium division includes the Vametco mine and processing facility, the Vanchem processing facility, and the future Mokopane vanadium mine and the Belco production plant. Glencore’s Rhovan open-cast mine and smelter complex mainly produces ferrovanadium and vanadium pentoxide.

4. Brazil

Vanadium production: 5,000 metric tons

Brazil’s vanadium output has also contracted year-over-year, totaling 5,000 metric tons in 2024 compared to 5,420 MT in 2023.

Brazil’s vanadium production is largely thanks to Largo Resources (TSX:LGO,NASDAQ:LGO), which describes itself as the only pure-play vanadium producer. The company’s Maracás Menchen vanadium asset is one of the highest-grade vanadium mines in the world.

FAQs for vanadium

Who is the largest exporter of vanadium?

Brazil is the world’s largest exporter of vanadium, with Russia in second place and China and South Africa nearly tied. Brazil alone is responsible for over one-quarter of the metal’s global export market, and the four combined represented 84 percent of the market in 2023.

Which country has the most vanadium reserves?

Australia has the highest vanadium reserves in the world, coming in at 8.5 million MT as of 2024, although it should be noted that only 3 million MT are JORC compliant. Russia is in second place with 5 million MT of vanadium reserves, while China is next in line with vanadium reserves of 4.1 million.

What is vanadium used for?

Vanadium is essential in various alloys, with the most common being ferrovanadium, an alloy of iron and vanadium metal that is used in steel production. Beyond these traditional applications, the silvery-gray metal’s uses in the battery industry are growing — it’s increasingly being used in vanadium redox batteries for large-scale stationary energy storage.

Securities Disclosure: I, Georgia Williams, hold no direct investment interest in any company mentioned in this article.

Securities Disclosure: I, Melissa Pistilli, hold no direct investment interest in any company mentioned in this article.

This post appeared first on investingnews.com

Uranium prices are on the rise after President Donald Trump signed a series of executive orders aimed at revitalizing the US nuclear industry — including measures to strengthen the domestic fuel supply and expand the nuclear workforce.

On Tuesday (May 27), the U3O8 spot price climbed to US$72 per pound, its first move above the US$70 mark since early February.

The positivity and Trump’s promise to fast track mine permits has also benefited uranium companies with projects in the US.

One of those companies is Anfield Energy (TSXV:AEC,OTCQB:ANLDF), which reported receiving federal approval from the US Department of the Interior for its Velvet-Wood uranium and vanadium project in Utah on Tuesday. The approval marks the first uranium mine greenlit under Trump’s emergency declaration to revive the domestic nuclear fuel cycle.

According to the statement, the Bureau of Land Management completed the environmental review in just 14 days, a timeline officials say reflects a broader shift toward prioritizing critical mineral projects.

“This approval marks a turning point in how we secure America’s mineral future,” said Secretary of the Interior Doug Burgum. “We’re reducing dependence on foreign adversaries and ensuring our military, medical and energy sectors have the resources they need to thrive.”

Shares of Anfield surged to a year-to-date high of C$0.115 following the news, and have since settled in the C$0.10 range.

Rising tide raises all ships

Although the US president’s latest round of executive orders have catalyzed prices in recent days, the uranium sector’s long term fundamentals have also offered support.

The growing demand from artificial intelligence data centers, paired with a push for carbon free energy sources makes a strong case for the expansion of nuclear energy capacity. As such, the current developments have added tailwinds to several uranium and nuclear sector players up and down the supply chain.

Over the past five trading days, enCore Energy (TSXV:EU,NASDAQ:EU) shares have risen 33.33 percent, from C$2.18 on May 22 to C$2.92 on Wednesday (May 28). The company holds a portfolio of various stage uranium projects located in Texas, Colorado, Wyoming and South Dakota. Currently, the Alta Mesa and Rosita projects in Texas are operational.

Uranium Energy (NYSEAMERICAN:UEC) has also seen its share price increase, adding 31 percent over the same five day period, to trade for US$2.89. Boasting a portfolio of 10 US uranium assets in various stages of development from exploration to near term production, the company also owns and operates the Hobson ISR processing plant in Texas, which is operational.

Ur-Energy (TSX:URE,NYSEAMERICAN:URG), which owns the producing Lost Creek mine and the construction-stage Shirley Basin project in Wyoming, is another company experiencing heightened investor interest this past week.

Shares of Ur-Energy rose 26.53 percent over the five day session, and are currently valued at C$1.24.

Diversified players like Western Uranium and Vanadium (CSE:WUC,OTCQX:WSTRF) were also buy targets following the president’s energy directive. The company, which is focused on advancing its past-producing Sunday mine complex in Colorado, saw its shares increase 28 percent since May 21, trading for C$1.14.

ASX-listed companies were also garnering attention, Boss Energy (ASX:BOE,OTCQX:BQSSF) in particular, which holds a 30 percent stake in the producing Alta Messa uranium mine. The joint venture partner for enCore saw its share price value grow 14.27 percent in the last five days, to AU$4.13.

While these companies were first to see Trump’s executive orders boost their share prices, there are many other US-focused uranium companies with projects all over the country now awaiting pro-nuclear upticks.

All share price information was obtained from TradingView on May 28, 2025. Data on project status was retrieved from Mining Data Online.

Securities Disclosure: I, Georgia Williams, hold no direct investment interest in any company mentioned in this article.

This post appeared first on investingnews.com

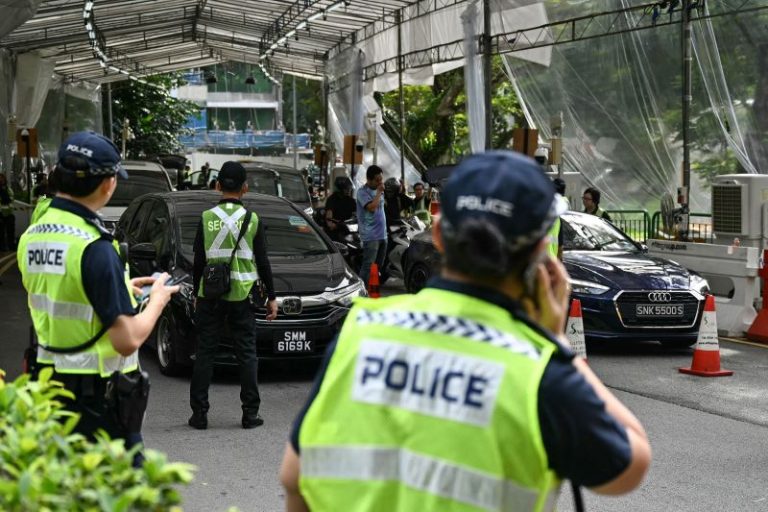
China will not send its defense minister to this year’s Shangri-La Dialogue, shunning a chance for a high-level meeting with US and Asian counterparts as tensions simmer with Washington.

China announced Thursday it will instead be represented by a delegation from the People’s Liberation Army National Defense University, marking the first time in five years a high-level delegation from Beijing will miss Asia’s largest defense and security summit.

The United States will be represented by Defense Secretary Pete Hegseth at the event, which often provides opportunities on the sidelines for rare face-to-face meetings between top generals and defense officials from the US and China.

Last year then-US Defense Secretary Lloyd Austin met with Minister of National Defense Adm. Dong Jun on the sidelines of the event and the two pledged to continue a US-China dialogue amid simmering military tensions over Taiwan and Chinese aggression in the South China Sea.

Beijing’s decision not to send Dong this year throws into question whether there will be any meeting between the US and China at a time of heightened tensions between the two.

China has railed against America’s efforts in recent years to tighten its alliances and defense posture in Asia, while economic frictions rose to historic levels earlier this year after US President Donald Trump’s imposition of tariffs on China sparked a tit-for-tat between the two countries that saw duties rise to more than 100% on each other’s goods.

While the two sides announced a temporary tariff truce earlier this month, tensions flared against this week. On Wednesday, two days before the forum’s opening, the US aimed a shock double punch targeting software exports to Chinese tech companies and study visas granted to Chinese students, risking a fragile trade war truce between Washington and Beijing.

At a Chinese Defense Ministry press conference on Thursday, a spokesperson ducked a question on why Beijing was not sending its defense minister to the Singapore forum, expected to be attended by defense chiefs from around Asia, including many more closely tied to Washington than Beijing.

China was “open to communication at all levels between the two sides,” a ministry spokesperson said when asked about a potential sidelines meeting with the US delegation.

“They’re torqued at us,” the official said.

“It’s a signal that they are concerned about the level of engagement, specifically with the United States, to send a message that everything is not completely normal within that and there’s probably some other underlying reasons about just uncertainty about what Shangri-La is intended to accomplish,” the official said.

China has traditionally had few friends at Shangri-La and its speakers face real-time, unscripted questioning from journalists and academics attending the conference.

Last year, Defense Minister Dong faced tough questions after, in a Friday note keynote speech, Philippine President Ferdinand Marcos Jr. denounced illegal, coercive and aggressive actions in the South China Sea in an apparent allusion to China.

China’s military has also been in the spotlight in recent years as its top ranks have been roiled by a sweeping corruption purge, with more than a dozen high-ranking figures in China’s defense establishment ousted since 2023.

Analysts said the absence of a high-level Chinese delegation at the defense summit may signal Beijing is emphasizing economics and trade over military relations in its foreign affairs at this time.

“While surely security engagements such (the Shangri-La Dialogue) … do matter in the broader scheme of geopolitics, at this juncture it seems regional governments are perhaps even more concerned about the tariff impact on their economies,” said Collin Koh, a research fellow at the S. Rajaratnam School of International Studies (RSIS) in Singapore

US is ‘here to deter adversaries’

Ahead of the weekend conference, much attention has focused on how US-led alliances across the region that grew during the Biden administration would hold up under Trump’s second term.

There was broad consensus among analysts that unlike the turmoil Trump has caused in Europe – with threats to pull back from NATO and abandon Ukraine in its fight against Russia’s invasion – the US role in Asia has largely been consistent, centered on a policy to counter Chinese influence and back Taiwan.

Hegseth’s first trip to Asia as Defense Secretary began in the Philippines – on the front lines of China’s increasingly aggressive posture in Asia – where he said the US would work with allies to “reestablish deterrence” to counter “China’s aggression” in the Indo-Pacific.

On Friday, during an early morning workout with sailors aboard a US Navy ship in Singapore, he had a similar message:

“We send the signal to our allies and partners, hey, here in the Indo Pacific, America’s here, and we’re not going anywhere. We’re here to deter adversaries who would seek us harm.” Analysts noted that US-led military exercises, especially those involving key allies Japan, Australia, the Philippines and South Korea, have continued or even been bolstered in 2025.

But while increased US involvement is welcome by those participating in such exercises, Washington must be careful they don’t aggravate China so much that new tensions threaten the security of regional nations that are not US treaty allies, said Evan Laksmana, editor of the 2025 Asia Pacific Regional Security Assessment compiled by the International Institute of Strategic Studies.

“The deepening of US security engagement is welcome but not so far on the strategic side that it raises tensions,” he said.

On Thursday, Chinese Defense Ministry spokesperson Senior Colonel Zhang Xiaogang said China “attaches great importance to the military relations” with the US, but warned Washington against “conjuring up a powerful enemy for itself whether intentionally or unintentionally.”

“Such imagination is not rational and extremely dangerous,” Zhang said.

This post appeared first on cnn.com