Archive

May 24, 2025

Browsing

The bullish signals stacked up in April and May, but most long-term breadth indicators are still bearish. SPY and QQQ showed signs of capitulation in early April and rebounded into mid April. A Zweig Breadth Thrust triggered on April 24th and several other thrust indicators turned bullish in May. We also saw SPY and QQQ break their 200-day SMAs. TrendInvestorPro is tracking these signals and relevant exit strategies.

These are bullish indications for large-caps and, perhaps, stocks in the top half of the S&P 500. However, I would not call it a bull market until participation broadens. The chart below shows the S&P 500 EW ETF (RSP) and S&P MidCap 400 SPDR (MDY) moving back below their 200-day SMAs. The S&P SmallCap 600 SPDR (IJR) never came close and remains a big laggard.   

The bottom window is perhaps the most telling. It shows the percentage of S&P 1500 stocks above their 200-day SMAs. This long-term breadth indicator did not cross above 50% in May. Except for a 1-day dip on January 10th, this indicator was above 50% from December 2023 to February 2025 (bull market). It broke below 40% on March 10th and has yet to fully recover (bear market).

At the very least, a move above 50% is needed to show broadening participation worth of a bull market. This is how the market moves from bullish thrust signals to a bull market.  Until such a move, we are still in bear market mode and risk remains above average for stocks. Note that the S&P 1500 includes large-caps (500), small-caps (600) and mid-caps (400). Around 2/3 of components NYSE stocks and 1/3 Nasdaq stocks. It is a truly representative of the broader market.

Exit strategies are just as important as entries. The Zweig Breadth Thrust and the 5/200 day SMA cross provided entry signals in April and May. We now need an exit strategy. TrendInvestorPro put forth exit strategies for both signals and these are updated in our reports. This week we covered the gap zones in SPY and QQQ, long-term breadth signals, big moves in metals and continued strength in Bitcoin. Click here to take a trial and gain full access.

 ////////////////////////////////////////////

My main question going into this weekend was, “Will the S&P 500 finish the week above its 200-day moving average?” And while the S&P 500 did indeed finish the week above this long-term trend barometer, our main equity benchmark is now within the gap range from earlier this month.

We’ll get to that crucial S&P 500 chart a little later, but first, I’d like to explain why gaps matter, why the price action post-gap is so important, and then apply these lessons to the SPX.

The “Gap and Run” Scenario Suggests an Influx of Buyers

One of two things tends to happen after a gap higher within an uptrend phase. The first scenario, which I call a “gap and run” pattern, is when additional buyers come in to push the price even higher.

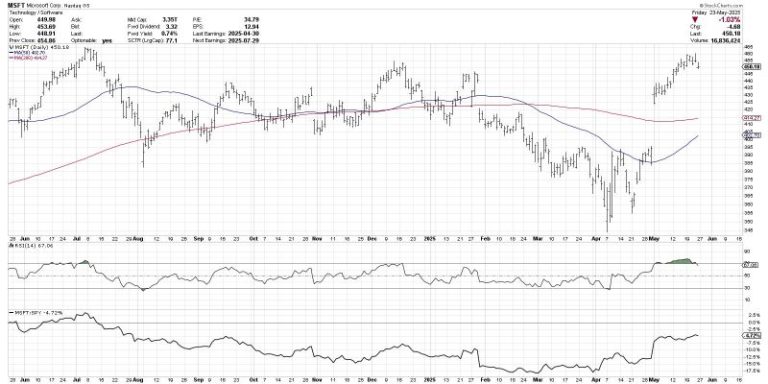
Microsoft Corp. (MSFT) features this gap and run pattern, with the gap higher on their Q1 earnings report followed by an additional appreciation in price.  Basically, investors are not afraid to accumulate more MSFT, even after the stock gapped up from $395 to $430 overnight.


Did you catch our recent webcast, “Sell in May 2025: Seasonal Strategy or Outdated Myth?” We looked at the performance in May-June-July since the COVID low, then made a comparison between 2025 and the first half of 2022, when a break below the 200-day moving average was a sign of much further deterioration to come.  Check out this excerpt on our YouTube channel!


Shares of Howmet Aerospace (HWM) demonstrated a similar gap and run pattern recently, although this example is perhaps even more significant because the gap took the price to a new all-time high! Again, we can see that additional buyers are coming in and accumulating more HWM, fueling further gains after the gap.

The “Gap and Fail” Pattern Shows a Lack of Willing Buyers

Sometimes, a chart will show a very different path after the gap, forming what I’ve termed a “gap and fail” pattern.  Unlike the previous examples, here you’ll see that a lack of willing buyers causes the stock to quickly reverse lower into the range of the price gap.

In the case of semiconductor producer Monolithic Power Systems (MPWR), the gap higher earlier this month was followed by two additional up days, which propelled the stock above its 200-day moving average. This short-term pop higher was followed by a sudden downside reversal, representing an exhaustion of buyers after the upside gap.

First Solar (FSLR) is demonstrating a similar pattern to MPWR, with a gap higher which pushed the stock just above the 200-day moving average to test the 38.2% Fibonacci retracement level. A couple days later, FSLR was back below the 200-day moving average, followed by further deterioration that eventually closed the gap from earlier in May.

The S&P 500 Could Test Its Own Gap Support

So what do those example charts have to do with the S&P 500? Well, the SPX traded higher for about a week after the upside gap in early May. We’ve drawn a green-shaded range to highlight the gap from around 5725 to 5780. This gap includes the 200-day moving average and also lines up with the late March swing high.

I see the S&P 500 as in a constructive pattern as long as it remains above this price gap range. If we can see an upswing after this week’s pullback, then this could just be a pause within a broader recovery phase for the S&P.

On the other hand, if we see any further price weakness from the major benchmarks next week, then the chart of the S&P 500 will start to look pretty similar to other “gap and fail” charts that confirm a lack of willing buyers. If we do see that downside follow-through next week, we’d expect further deterioration to the 5500 level, representing a 50% retracement of the February to April selloff phase.

RR#6,

Dave

P.S. Ready to upgrade your investment process? Check out my free behavioral investing course!


David Keller, CMT

President and Chief Strategist

Sierra Alpha Research LLC

marketmisbehavior.com

https://www.youtube.com/c/MarketMisbehavior


Disclaimer: This blog is for educational purposes only and should not be construed as financial advice. The ideas and strategies should never be used without first assessing your own personal and financial situation, or without consulting a financial professional.

The author does not have a position in mentioned securities at the time of publication. Any opinions expressed herein are solely those of the author and do not in any way represent the views or opinions of any other person or entity.

In this insightful overview, Grayson dives into StockCharts’ powerful scanning capabilities. He shows you how to navigate the markets quickly with the sample scan library, and automate your stock screening with the scheduled scans feature.

This video originally premiered on May 23, 2025. Click on the above image to watch on our dedicated Grayson Roze page on StockCharts TV.

You can view previously recorded videos from Grayson at this link.

This week, while everyone else is focused on NVIDIA Corp. (NVDA), we will focus our attention on stocks with earnings that may get overlooked.

We’re watching a different group of stocks heading into earnings: Okta, Inc. (OKTA), AutoZone, Inc. (AZO), and Salesforce.com, Inc. (CRM). OKTA and AZO are making new highs as they head into their earnings call, while CRM is struggling.

Let’s break down the best risk/reward set-ups as we kick off the week.

Okta, Inc. (OKTA): Volatility Now, Potential Later

Okta’s stock price broke out to new 52-week highs a week before it posts its quarterly numbers. The cybersecurity company has experienced extreme volatility after posting earnings. In the last three quarters, the stock saw some pretty big swings—up 24.3%, up 5.4%, and down 17.6%. Its average price change post-earnings is +/-10.2%.

Technically, I love this setup. Let’s look at a five-year daily chart.

Shares have broken out ahead of earnings and have a lot to reverse. If we see weakness after results, there are several support areas where we would want to enter the stock with favorable risk/reward. The first strong support area is between $115/$118, an old resistance level that the stock just eclipsed. Old resistance could act as new support and provide an opportunity.

Outside of recent weakness due to “Liberation Day,” OKTA’s stock price has outperformed its peers and held key moving averages. Use levels just below the 50-day moving average around $110 as a near-term stop if $115 doesn’t hold.

To the upside, there is much to reverse and targets of $150 to $160 are attainable. If you’re a longer-term investor, the downtrend is broken and the bulls are back in charge.

AutoZone, Inc. (AZO): Riding Steady 

The retail leader in automotive replacement parts and accessories, AutoZone, Inc. (AZO), continues to rise, slowly and steadily, despite market volatility. The stock price is up 20% year-to-date, and we hope to add to those gains when they report on Tuesday morning.

One thing that has helped AZO’s continued growth is that the average car is roughly 12 years old. Consumers are investing more in maintenance and repairs instead of purchasing new vehicles. And with tariffs, buying a new car becomes more expensive, which benefits the car repair and maintenance business.

Let’s look at that long-term uptrend on a weekly chart going back five years.

The stock is a juggernaut. It has ridden the 50-week moving average consistently since Covid. It is in a beautiful uptrend and made new highs again just last week.

While the trend itself appears a tad extended above its averages, any trip back towards its recent uptrend line gives investors a strong entry point, with downside risk towards its 50-week moving average.

It’s also the best in class when compared to its top competitors, such as O’Reilly Automotive (ORLY) and Advanced Auto Parts (AAP). When looking at strong uptrends in a challenging environment, it’s best to find the best in class, and AZO continues to be just that. The trend continues to be the investor’s best friend.

Salesforce (CRM) Hits a Crossroads

A year ago, Salesforce (CRM) shocked investors with a revenue miss for the first time since 2006. This resulted in the stock price dropping 20% (red box in the chart below). It marked the stock’s low point, as it rallied as much as 74% over the next seven months. It now sits in the middle of a wide year-long range and is poised to move again.

Which way will it go? To examine that question, let’s look at the daily chart of CRM.

Technically, shares are at a crossroads. Shares dropped 37% from their December peak after forming a double top. It just broke its near-term downtrend from its post-Liberation Day lows, experiencing a 28% rally, but paused right at its 200-day moving average.

Momentum appears to be negative. The Moving Average Convergence/Divergence (MACD) has formed a bearish crossover, and shares failed to eclipse the 200-day. Shares are down -18% for 2025, underperforming the tech sector and the S&P 500. CRM sold off late Friday, hitting its 50-day moving average, on news that it’s in talks to acquire Informatica.

If you’re thinking of buying CRM, you may want to hold your horses. Watch the 50-day moving average around $270 to see if it can hold. On strength, look for confirmation and a close above the $295 level for an all clear that momentum has finally shifted in favor of the bulls.

Final Thoughts

OKTA, AZO, and CRM are thoughtful plays based on technical trends and real-world fundamentals. OKTA and AZO could have favorable risk/reward setups. As for CRM, add it to your ChartLists and monitor it regularly.


It scares me to admit I’ve been investing for over 50 years. It’s been a great ride, and fortunately I’m still going strong. One of my investment mantras thru all these years has been Charlie Munger’s quintessential advice: “try to be consistently not stupid.”

We all make investing mistakes, but not all of us learn the appropriate lessons from those mistakes. This blog is less about mistakes and more about lessons. If the investment genie were to offer me a redo on my portfolio management execution from these past decades, here are seven things I would do differently next time around.

  1. More USA, less international. I know what you’re thinking—what about diversification? But I believe that William O’Neil had it right all along. American ingenuity is where you want to invest. Besides, great American companies do business all over the globe. Microsoft is doing your diversification for you.
  2. Hot money managers are not worth chasing. I’ve been guilty of this. Sometimes it works, but only if you get in early and don’t overstay to the point when their hot hand inevitably cools — and it will. I have a long list of managers who can claim this crown.
  3. Keep it simple. Adding complexity or asset classes or different methodologies to your portfolio mix seldom results in outperformance, but we investors will continue to be tempted. Something about human nature wants to seek out complexity. Fight the urge.
  4. Private equity and hedge funds. Recently, the number of new funds and new money has swollen significantly. I never liked the high fees, long terms and lack of liquidity. There are just too many other sensational stock market options (albeit less sexy for cocktail party discussions.)
  5. Fees matter. Even small differences matter and will add up over time. Too often, investors pay for the Los Angeles Dodgers and end up getting the Wichita Mudcats.
  6. Ride those winners! I’ve had five long term holdings that have paid a lot of bills. Hold tight when you find an AMZN, MSFT, COST, V, or MA.
  7. Investing is the art of man versus markets. The voodoo within investing is how best to control your Investor Self. If you memorize only one of the 10 Essential Stages of Stock Market Mastery from our book, let it be Stage 3—The Investor Self.

Trade well; trade with discipline!

Gatis Roze, MBA, CMT

StockMarketMastery.com

  • Author, “Tensile Trading: The 10 Essential Stages of Stock Market Mastery” (Wiley, 2016)
  • Developer of the “Stock Market Mastery” ChartPack for StockCharts members
  • Presenter of the best-selling “Tensile Trading” DVD seminar
  • Presenter of the “How to Master Your Asset Allocation Profile DVD” seminar

P.S. If you would like to be notified when I post a new Traders Journal blog, please submit your preference via the tile in the right column titled FOLLOW THIS BLOG.

‘Not for distribution to United States newswire services or for dissemination in the United States.’

Forte Minerals Corp . ( ‘ Forte ‘ or the ‘ Company ‘ ) ( CSE: CUAU ) ( OTCQB: FOMNF ) ( Frankfurt: 2OA ), intends to complete a non-brokered private placement (the ‘Offering’) to raise up to C$2,400,000 for drilling and exploration programs on the Company’s Peruvian projects and for general working capital, all as further outlined below.

The Offering involves the sale of up to 6,000,000 units (each a ‘Unit’) at a price of $0.40 per Unit.

Unit Terms:

  • Each Unit: one common share and one-half of one common share purchase warrant
  • Warrant: each whole warrant exercisable for one common share at C$0.60 until the date that is 24 months from the closing of the Offering, provided the warrants are subject to accelerated exercise such that if the closing price of the Company’s common shares exceeds C$0.90 per share for a period of 20 consecutive trading days, the Company may give notice of the acceleration of the warrants’ term to a period of 30 days following such notice.

All securities issued will be subject to a statutory four-month-plus-one-day hold period in accordance with applicable Canadian securities laws. Additional restrictions may apply pursuant to the Securities Act of 1933, as amended, to U.S. investors, if any.

Use of Proceeds:

  • Pucarini: Inaugural five-hole drill program for total of 1750m scheduled to start this July 2025.
  • Esperanza : MT Survey
  • Alto Ruri : DIA Drill Permitting and Community Agreements, surface exploration work including follow-up alteration and geological mapping, geochemical sampling, spectral analysis, IP and CSMAT.
  • General working capital

Finder’s fees may be paid to eligible persons in connection with the Offering, subject to the policies of the CSE.

The Company, at its discretion, reserves the right to increase the size of the Offering by up to $300,000.00 through the sale of 750,000 additional Units, for an aggregate Offering not exceeding $2,700,000.

We appreciate our shareholders’ continued confidence,’ stated Patrick Elliott, President and CE O. ‘This financing positions us to drill test a high sulphidation system that’s never been drilled and to unlock the value of Alto Ruri, Esperanza and Miscanthus .’

The Offering is expected to close on or before June 15, 2025, subject to customary conditions, including the receipt of all required regulatory approvals .

ABOUT Forte Minerals CORP.

Forte Minerals Corp. is an exploration company with a strong portfolio of high-quality copper (‘ Cu ‘) and gold (‘ Au ‘) assets in Perú. Our strategic partnership with GlobeTrotters Resources Perú S.A.C. (‘ GTR ‘) grants us access to a comprehensive project pipeline, enabling us to target the most promising opportunities. This collaboration focuses on historically discovered, drill-ready targets, driving significant value in Cu and Au resource development.

On behalf of  Forte Minerals CORP.
(signed) ‘ Patrick Elliott’
Chief Executive Officer

For further information, please contact:
Forte Minerals Corp.
office: (604) 983-8847
info@forteminerals.co m
www.forteminerals.com

Certain statements included in this press release constitute forward-looking information or statements (collectively, ‘forward-looking statements’), including those identified by the expressions ‘anticipate’, ‘believe’, ‘plan’, ‘estimate’, ‘expect’, ‘intend’, ‘may’, ‘should’ and similar expressions to the extent they relate to the Company or its management. The forward-looking statements are not historical facts but reflect current expectations regarding future results or events. This press release contains forward looking statements. These forward-looking statements and information reflect management’s current beliefs and are based on assumptions made by and information currently available to the company with respect to the matter described in this new release. Forward-looking statements involve risks and uncertainties, which are based on current expectations as of the date of this release and subject to known and unknown risks and uncertainties that could cause actual results to differ materially from those expressed or implied by such statements. Additional information about these assumptions and risks and uncertainties is contained under ‘Risk Factors and Uncertainties’ in the Company’s latest management’s discussion and analysis, which is available under the Company’s SEDAR+ profile at www.sedarplus.ca, and in other filings that the Company has made and may make with applicable securities authorities in the future.

Forward-looking statements are not a guarantee of future performance and involve risks, uncertainties and assumptions which are difficult to predict. Factors that could cause the actual results to differ materially from those in forward-looking statements include the continued availability of capital and financing, and general economic, market or business conditions. Forward-looking statements contained in this press release are expressly qualified by this cautionary statement. These statements should not be read as guarantees of future performance or results. Such statements involve known and unknown risks, uncertainties and other factors that may cause actual results, performance or achievements to be materially different from those implied by such statements. Although such statements are based on management’s reasonable assumptions, there can be no assurance that the statements will prove to be accurate or that management’s expectations or estimates of future developments, circumstances or results will materialize. The Company assumes no responsibility to update or revise forward-looking information to reflect new events or circumstances unless required by law. Readers should not place undue reliance on the Company’s forward-looking statements.

Neither the Canadian Securities Exchange (the ‘CSE’) nor its Regulation Services Provider (as that term is defined in the policies of the CSE) accepts responsibility for the adequacy or accuracy of this release.

News Provided by GlobeNewswire via QuoteMedia

This post appeared first on investingnews.com

Virtual Investor Conferences, the leading proprietary investor conference series, today announced the presentations from Precious Metals & Critical Minerals Hybrid Virtual Investor Conference held May 22 nd are now available for online viewing.

VIEW PRESENTATIONS HERE

The company presentations will be available 24/7 for 90 days. Investors, advisors, and analysts may download
investor materials from the company’s resource section.

May 22 nd

Presentation Ticker(s)
Keynote Presentation: ‘What’s next for precious metals?’
-Jeff Christian, Managing Partner of CPM Group
Viva Gold Corp. (OTCQB: VAUCF | TSXV: VAU)
StrikePoint Gold, Inc. (OTCQB: STKXF | TSXV: SKP)
Honey Badger Silver Inc. (OTCQB: HBEIF | TSXV: TUF)
Relevant Gold Corp. (OTCQB: RGCCF | TSXV: RGC)
Keynote Presentation: ‘Surveying the Critical Metals Landscape,’
–Jack Lifton, Senior Advisor, Energy Fuels, Inc.
Azimut Exploration Inc. (OTCQX: AZMTF | TSXV: AZM)
Energy Fuels Inc. (NYSE American: UUUU | TSX: EFR)
Lion Copper & Gold Corp. (OTCQB: LCGMF | CSE: LEO)
Alaska Silver Corp. (Pink: WAMFF |TSXV: WAM)
Cygnus Metals Ltd. (OTCQB: CYGGF |TSXV: CYG |ASX: CY5)
Power Metallic Mines, Inc. (OTCQB: PNPNF |TSXV: PNPN)

To facilitate investor relations scheduling and to view a complete calendar of Virtual Investor Conferences, please visit www.virtualinvestorconferences.com .

About Virtual Investor Conferences ®

Virtual Investor Conferences (VIC) is the leading proprietary investor conference series that provides an interactive forum for publicly traded companies to seamlessly present directly to investors.

Providing a real-time investor engagement solution, VIC is specifically designed to offer companies more efficient investor access. Replicating the components of an on-site investor conference, VIC offers companies enhanced capabilities to connect with investors, schedule targeted one-on-one meetings and enhance their presentations with dynamic video content. Accelerating the next level of investor engagement, Virtual Investor Conferences delivers leading investor communications to a global network of retail and institutional investors.

Media Contact:  
OTC Markets Group Inc. +1 (212) 896-4428, media@otcmarkets.com

Virtual Investor Conferences Contact:
John M. Viglotti
SVP Corporate Services, Investor Access
OTC Markets Group
(212) 220-2221
johnv@otcmarkets.com

News Provided by GlobeNewswire via QuoteMedia

This post appeared first on investingnews.com

Here’s a quick recap of the crypto landscape for Friday (May 23) as of 9:00 a.m. UTC.

Get the latest insights on Bitcoin, Ethereum and altcoins, along with a round-up of key cryptocurrency market news.

Bitcoin and Ethereum price update

Bitcoin (BTC) was priced at US$110,637 as markets closed, down 2.4 percent in 24 hours. The day’s range for the cryptocurrency brought a low of US$108,334 and a new all-time high of US$111,814.

Bitcoin performance, May 23, 2025.

Chart via TradingView.

Ethereum (ETH) finished the trading day at US$2,659.55, a 3.5 percent decrease over the past 24 hours. The cryptocurrency reached an intraday low of US$2,541.09 and saw a daily high of US$2,720.92.

Altcoin price update

  • Solana (SOL) closed at US$179.09, down 0.5 percent over 24 hours. SOL experienced a low of US$176.13 and a high of US$186.92.
  • XRP is trading at US$2.43, reflecting a 3.0 percent decrease over 24 hours. The cryptocurrency reached a daily low of US$2.34 and a high of US$2.47.
  • Sui (SUI) is priced at US$3.83, showing a decreaseof 5.0 percent over the past 24 hours. It achieved a daily low of US$3.62 and a high of US$3.96.
  • Cardano (ADA) is trading at US$0.7973, down 3.2 percent over the past 24 hours. Its lowest price of the day was US$0.7717, and it reached a high of US$0.8341.

Today’s crypto news to know

Bitcoin price blasts past US$111,000

Bitcoin soared to a new all-time high of US$111,980 this week, extending its bull run on the back of rising institutional demand and increasingly vocal political support from Donald Trump.

The rally came as Trump hosted a private dinner at his Virginia golf club for top holders of his $TRUMP memecoin, an event that underscored his pivot to becoming crypto’s most visible political backer.

Analysts pointed to surging interest from entities like Strategy (formerly MicroStrategy), which just filed to sell US$2.1 billion in stock to buy more Bitcoin, as a key driver.

The rally is also fueled by expectations of clearer crypto regulation, with the Senate advancing a pro-stablecoin bill that Trump allies have framed as a pro-growth measure.

Major US banks bill unified Stablecoin

Several of the biggest US banks — including JPMorgan, Wells Fargo, Bank of America, and Citigroup — are in early discussions to jointly launch a stablecoin, according to a new Wall Street Journal report.

The goal: to create a financial instrument that can keep pace with crypto-native payment systems and prevent a further shift away from traditional finance.

Industry insiders say payment infrastructure arms like Zelle’s operator, Early Warning Services, and The Clearing House are also involved in talks. The stablecoin would likely be dollar-pegged and open to broader banking adoption beyond the founding consortium, reflecting a desire to modernize settlement rails and attract fintech interest.

The move comes as the GENIUS Act gains momentum in the US Senate, laying the groundwork for a formal regulatory framework around stablecoins.

Sun praises Trump at dinner, calls memecoins ‘underrated’

Justin Sun, once under legal siege during the Biden administration, was front and center at Donald Trump’s exclusive dinner for TRUMP memecoin whales — using the moment to declare a new era for crypto in the US.

In an interview after the event, Sun pushed back against critics who accused the memecoin gathering of being a crypto-access-for-cash scheme, saying skeptics are missing the big picture.

Sun has been a key figure in Trump’s crypto orbit since late last year, reportedly investing up to US$75 million in Trump-affiliated crypto projects, including World Liberty Financial tokens.

Legal issues still follow Sun — including an ongoing DOJ investigation — but his comments make clear that the crypto industry sees Trump’s administration as a major opening.

Ember Sword becomes latest Web3 game casualty amid market slump

Ethereum-based MMORPG Ember Sword has shut down its development, citing an inability to raise sufficient funding despite a previously strong start and multimillion-dollar NFT land sales.

The studio behind the game posted a farewell note to supporters, saying that even with early access launched and high-profile advisors onboard, current market conditions were too harsh to sustain the project.

The team had switched platforms multiple times — from Polygon to Immutable X and later to Mantle — in search of better scalability, but the moves weren’t enough to keep the dream alive.

Ember Sword joins a growing list of web3 gaming failures this year, including Deadrop and Tatsumeeko, as investor appetite for blockchain games cools significantly. The game’s token, EMBER, has lost over 99 percent of its value from its peak, now trading at a mere US$0.00047.

Securities Disclosure: I, Giann Liguid, hold no direct investment interest in any company mentioned in this article.

This post appeared first on investingnews.com

It was a slow start to the week for gold, but it didn’t take long for the price to pick up.

The yellow metal began the period at the US$3,220 per ounce level, but was gaining steam by Tuesday (May 20), briefly breaking US$3,300. Gold continued higher the next day, and after pulling back briefly on Thursday (May 22) was able to finish the week strong, changing hands at the US$3,360 level.

Bond market turmoil is one factor that’s been influencing gold’s price movements.

A Wednesday (May 21) auction of 20-year bonds was poorly received, with yields surging past 5.1 percent to reach the highest level seen since November 2023. Yields for 10-year and 30-year bonds were also on the rise, with the latter nearing a two-decade high as stocks and the dollar took hits.

The upheaval in bonds came on the back of US President Donald Trump’s efforts to get the One Big Beautiful Bill through the House. Slowing the passage of the wide-ranging domestic policy package were concerns that Trump’s plan to cut taxes would significantly increase US debt.

‘Make no mistake, the bond market will have its own vote on the terms of the budget bill. It doesn’t seem this president or this Congress is actually going to meaningfully reduce the deficit’ — George Catrambone, DWS Americas

Last week’s downgrade of US debt from Moody’s (NYSE:MCO) also didn’t help bonds. The agency bumped its rating down from AAA, its highest ranking, to AA1, which is one step lower. It expects even larger deficits in the US in the coming decade as government revenue stays flat and entitlement spending rises.

The One Big Beautiful Bill ultimately passed on Thursday by a very slim margin, receiving 215 votes in favor and 214 against. It will now proceed to the Senate, where it may face further obstacles.

Contained in the bill are tax cut extensions for both individuals and corporations, as well as provisions for removing taxes on tips and overtime. Among other points, it also allows for tax deductions on American-made vehicles, and offers ‘Trump savings accounts’ for newborns. It cuts funding to initiatives like Medicaid and the Supplemental Nutrition Assistance Program, better known as SNAP.

Preliminary analysis from the Congressional Budget Office, which is a nonpartisan organization, suggests that the bill will increase the federal deficit by US$3.8 trillion during the 2026 to 2034 period.

Bullet briefing — Trump signs nuclear orders, ECB issues gold warning

Trump executive orders boost uranium stocks

The uranium sector got a boost on Friday (May 23) after Trump signed several executive orders geared at overhauling the country’s Nuclear Regulatory Commission and speeding up nuclear reactor deployment.

‘It’s a hot industry. It’s a brilliant industry. You have to do it right,’ Trump told reporters about the nuclear energy sector. The executive orders also focus on power up US uranium mining and enrichment, and will allow nuclear reactors to be built on federal land.

The news sent uranium stocks powering higher, with sector major Cameco (TSX:CCO,NYSE:CCJ) closing the day up 10.04 percent at C$80.55. Denison Mines (TSX:DML,NYSEAMERICAN:DNN) and Uranium Energy (NYSEAMERICAN:UEC) saw even larger gains of 13.49 percent and 25 percent, respectively.

The Sprott Uranium Miners ETF (ARCA:URNM) finished up 12.14 percent.

Gold a threat to financial stability?

A note from the European Central Bank (ECB) turned heads this week with the suggestion that certain dynamics could make the gold market a threat to financial stability. Here’s a key excerpt from the report:

While gold prices are driven by many factors, investors showed high demand for gold as a safe haven asset and, at the beginning of 2025, a notable preference for gold futures contracts to be settled physically. These dynamics hint at investors’ expectations that geopolitical risks and policy uncertainty could remain elevated or even intensify in the foreseeable future. Should extreme events materialise, there could be adverse effects on financial stability arising from gold markets.

The full ECB report is definitely worth a read if you have the time.

China’s April gold imports surge

Gold’s high price hasn’t deterred buyers in China — new customs data from the country shows that April imports clocked in at 127.5 metric tons, an 11 month high.

That’s also a 73 percent increase from the previous month, according to Bloomberg. The news outlet notes that China’s central bank controls the flow of gold in and out of the country, so the strong increase is likely the result of fresh quotas given to some commercial banks.

Securities Disclosure: I, Charlotte McLeod, hold no direct investment interest in any company mentioned in this article.

This post appeared first on investingnews.com