Archive

May 17, 2025

Browsing

For those of you who are a bit more steeped in technical analysis, you’ve likely heard of Dow Theory. A set of principles developed from Charles Dow, a journalist/analyst who founded what’s now the Wall Street Journal back in the late 19th century, Dow’s insight was foundational to modern technical analysis.

Here’s a question: How can we view today’s market using Dow Theory’s six core tenets?

The market seems to be turning around, especially after the recent 90-day pause in U.S.-China tariffs. What insights might Dow Theory give us about the current reversal? Let’s dive in.

#1: The Market Discounts All Known Information

Here’s the thing: When tariffs are used as a nimble and adjustable strategy for hardball negotiations, how can anyone possibly price in the data? Too many unknowns are hiding behind the cards played for the market to discount any data driven by fundamentals and geopolitics.

So, this tenet can probably be skipped for now.

#2: The Market Has Three Movements

We’d have to modify this slightly, as markets, several of which are globally accessible 24/5 via futures and digital platforms, have significantly altered the market dynamics since Dow’s time.

Still, his notion of primary and secondary trends is as relevant today as it was then. But increased market access and trading volume have created tertiary or micro-trends on a scale above the Dow’s third movement of daily fluctuations.

Take a look at this 15-year monthly chart of the S&P 500 Large Cap Index ($SPX).

FIGURE 1. MONTHLY CHART OF THE S&P 500. The primary trend is up and is reversing from a deep secondary correction.

According to this tenet, one way to interpret this is that the primary trend is bullish and the corrections and bear markets, highlighted in yellow, are all secondary trends, as dramatic as they were on a smaller time scale.

Key insight: SPX’s primary trend is bullish, but the question is whether it has pulled out of its bearish secondary trend. It’s now trading above its 10-month simple moving average (SMA), which is roughly equivalent to a 200-day SMA, but whether it can hold is something to monitor.

#3: Primary Trends Have Three Phases

Is the broader market in an accumulation phase, where professional investors buy undervalued assets, a public participation phase, where retail investors are jumping in, or a distribution phase, where smart money sells to the euphoric retail crowd?

Take a look at this weekly chart.

FIGURE 2. WEEKLY CHART OF THE S&P 500. These indicators are based on surveys of retail and professional investor sentiment.

Two ways to gauge retail and professional sentiment and participation are by analyzing the American Association of Individual Investors (AAII) and National Association of Active Investment Managers (NAAIM) surveys (respectively). Look at the current week (blue dotted line) and note how the AAII Bull-Bear indicator representing retail sentiment is still net bearish while the NAAIM indicator shows accumulation as the S&P 500 gaps above the 40-day SMA (equivalent to its 200-day counterpart).

In the weeks leading up to the current week, as the NAAIM levels increased while the AAII remained net bearish, the contrast between the two arguably signals the strong likelihood that the broader market is in the accumulation phase. But remain cautious as, with the first tenet on known information, any new information or change in global trade policy can disrupt this picture, sending the $SPX back below the 40-week.

#4: The Averages Must Confirm Each Other

Back in his day, Charles Dow was referring to the Dow Jones Industrial Average ($INDU) and the Dow Jones Transportation Average ($TRAN). Today, most investors look at the $INDU alongside $SPX and the Nasdaq Composite ($COMPQ).

FIGURE 3. CHART OF THE BIG THREE U.S. MARKET INDICES. Visually, the charts look similar, but a closer look is warranted to see the differences in detail.

While the differences in price action are nuanced, a quick scan of all three on the StockCharts Market Summary page will tell you that all three indexes are more or less on even footing. But in the interest of saving space and not zooming in on each chart,at the time of writing, only the $SPX and $COMPQ are trading above their 200-day SMA; $INDU is just right below it.

Another way to measure this is by comparing market breadth, aka participation.

FIGURE 4. MARKET SUMMARY OF BREADTH AND BULLISH PERCENT INDEX. These indicators focus on market participation, something that price alone can’t show.

The window on the left tells you the percentage of stocks in each index trading above their 20-, 50-, 100-, and 200-day moving averages. Given the importance of the 200-day SMA, we’ll focus on that. While this window doesn’t show $INDU, you can see that over 54% of $SPX stocks and only 33% of $COMPQ stocks are trading above their 200-day SMA. However, the Nasdaq 100 Index ($NDX), a more tech-concentrated subgroup of $COMPQ, has the most bullish reading, with 64% of its stocks trading above this key level.

Switching over to the Bullish Percent Index (BPI) window on the right, the $SPX and $INDU have the strongest bullish participation with 74% and 83% of their stocks, respectively, signaling Point & Figure Buy Signals. The $COMPQ, at only 50%, is lagging the two (not the case with $NDX, however, which is also very bullish).

So, do the averages confirm each other? More or less, yes, with $COMPQ as the laggard. This may indicate a bullish turnaround in the secondary trend, but the secondary trend is also extremely vulnerable to sudden shifts in the geopolitical environment.

#5: Volume Confirms the Trend

Volume-based indicators that can help you gauge buying/selling pressure and accumulation and distribution.

FIGURE 5. CHART OF THE BIG THREE US MARKET INDEXES WITH VOLUME INDICATORS. Volume-based indicators like Chaikin Money Flow and Accumulation/Distribution Line give valuable insight into buying/selling pressure and accumulation/distribution.

The Chaikin Money Flow (CMF) is positive in all three indexes, indicating more buying pressure than selling pressure. While the CMF readings are not as strong as they were in January and February, you might expect the levels to rise if the overall market begins to turn. The Accumulation/Distribution Line (ADL) is also exhibiting a steady increase, more so in the $SPX and $COMPQ than in the $INDU, which appears to be flattening.

In summary, volume is confirming the turnaround, but tentatively and cautiously.

#6: A Trend Remains in Effect Until a Clear Reversal Occurs

This is where a close examination of the underlying secondary trend structure is critical. You may have different ways to gauge when a market is trending up or down, or not trending at all.

I usually begin (and sometimes end) by looking at the relationship between price and sequential swing highs and swing lows. For example, take a look at this daily chart of $INDU.

FIGURE 6. DAILY CHART OF THE DOW JONES INDUSTRIAL AVERAGE INDEX. The index has reversed to the upside, but it’s important to monitor these key levels to determine whether the current reversal will develop into an uptrend.

Note that I’m using the ZigZag line to market the key swing highs and lows on the chart.

$INDU’s downtrend reversed when it broke above 40,750, the two swing high points that marked a key resistance level. Now, $INDU is aiming to challenge the next swing highs (resistance levels), which are situated in the range between 42,500 and 43,000. For the reversal to develop into an uptrend, $INDU must stay above the most recent swing low of 37,750 and eventually break above 43,000.

In short, and according to Dow theory, the downtrend has been broken, but the uptrend has not yet been confirmed by the price action.

At the Close

Dow Theory may be over a century old, but its principles remain surprisingly resilient, especially when viewed through the lens of today’s volatile, information-saturated markets. Right now, we’re seeing a bullish reversal in the markets. However, this reversal is happening on the secondary trend level, which is extremely vulnerable to sudden and severe shifts in today’s volatile geopolitical environment. In short, the trend may be turning, but as Charles Dow himself might suggest, don’t call it an uptrend until it proves itself.


Disclaimer: This blog is for educational purposes only and should not be construed as financial advice. The ideas and strategies should never be used without first assessing your personal and financial situation, or without consulting a financial professional.

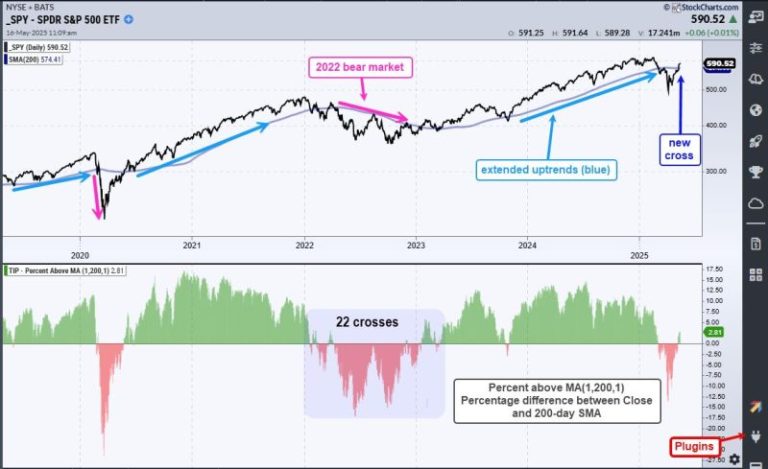
SPY and QQQ crossed above their 200-day SMAs with big moves on Monday, and held above these long-term moving averages the entire week. The V-Reversal was extraordinary and SPY seems short-term overbought, but this cross above the 200 day SMA cross is a bullish signal for the most important market benchmark. Despite a bullish signal, long-term moving averages are trend-following indicators and it is important to set realistic expectations.

***** This is an abbreviated version of a research report covering the 200-day SMA, performance improvements and a twist for QQQ. Recent reports at TrendInvestorPro covered the V-Reversal, the Bottoming Process and an Exit Strategy for the Zweight Breadth Thrust. Click here to take a trial and get immediate access. *****

The chart below shows SPY with the 200-day SMA (blue). This 200-day cross captured two big uptrends since 2020 and foreshadowed the bear market in 2022. Even though these three signals look great, there were plenty of whipsaws along the way. SPY crossed the 200-day SMA 141 times since 2005, which averages 7 crosses per year. Averages can be deceptive because some years have more crosses than others. SPY did not cross its 200-day in 2021 and 2024, but there were 22 crosses between January 2022 and March 2023.

The indicator window shows Percent above MA (1,200,1) to better highlight these crosses. It turns positive (green) with a bullish cross and negative (red) with a bearish cross. The values are the percentage difference between the close and the 200-day SMA.  

There is no such thing as a perfect indicator. Trend-following indicators are great at catching big trends, but they are also prone to whipsaws (failed signals). Whipsaws are simply the price of admission for a trend-following strategy. We must take the good (big trends) with the bad (whipsaws). As the chart above confirms, trend-following works over time because one good trend pays for the whipsaws.

Chartists can improve 200-day SMA signals with a little smoothing. For example, use a 5-day SMA instead of the close. Since 2005, the 5-day SMA crossed its 200-day SMA 55 times, which averages out to 3 per year. Fewer signals means fewer whipsaws. Also note that this smoothing generated higher returns and lower drawdowns.

The chart above shows the SPY with Percent above MA (5,200,1). This indicator captures the percentage difference between the 5 and 200 day SMAs. Instead of 22 crosses between January 2022 and March 2023, the 5-day SMA crossed the 200-day SMA just 8 times. This indicator is part of the TIP Indicator Edge Plugin for StockCharts ACP.

We can reduce whipsaws even more by adding a signal filter. This next section will cover signal filters and performance metrics for SPY. We then show how other ETFs perform and add little twist to improve performance for QQQ signals. This section continues for subscribers to TrendInvestorPro. Click here to take a trial and get immediate access. 

////////////////////////////////////////

If you didn’t check in on the stock market the last couple of weeks, you might be surprised to see how strong they were this week.

The three major stock indexes — S&P 500 ($SPX), Nasdaq Composite ($COMPQ), and Dow Jones Industrial Average ($INDU) — broke through their 200-day simple moving averages (SMAs) and are about 3–5% away from their all-time highs.

The Dow took a bit of a hit early this week, mostly because shares of UnitedHealth Group, Inc. (UNH) took a tumble. By Friday, though, the Dow recovered.

A Clearer Outlook Ahead

After dealing with an uncertain market, we’re finally seeing some encouraging signs. Large-cap growth stocks are trying to regain the lead, market breadth is improving (i.e. broader participation), and the Cboe Volatility Index ($VIX) has cooled off significantly.

Another helpful signal — the Bullish Percent Index (BPI) — is above 50% for the major indexes. This suggests that bulls are in control. In the 11 S&P sectors, there’s been a switcheroo. Consumer Staples and Utilities now have a BPI below 50%.

FIGURE 1: BULLISH PERCENT INDEXES FOR THE S&P SECTORS. Consumer Staples and Utilities are below 50%.

Want to dig into this yourself? You can view the full picture on the Market Summary page at StockCharts.com.

Image source: StockCharts.com. For educational purposes.

AI Stocks Back in the Spotlight

If you’ve been following the buzz around artificial intelligence (AI), you know it’s a hot area. This week proved that AI stocks still had their mojo. A mix of headlines, from new global investments in AI to easing tech regulations, gave these stocks a boost.

The VanEck Vectors Semiconductor ETF (SMH) jumped over 10% this week. And NVIDIA Corp. (NVDA), one of the biggest names in AI, surged 16% for the week. The stock is now trading above its 200-day SMA and approaching its February high, which could act as a resistance level. This is the first time NVDA’s stock price broke above its 200-day SMA after breaking below it on February 27.

Other big names like Broadcom Inc. (AVGO) and Taiwan Semiconductor Mfg. (TSM) also saw solid gains.

FIGURE 2. SEMICONDUCTORS MARKETCARPET. Note that NVDA, AVGO, and TSM saw strong gains this week.Image source: StockCharts.com. For educational purposes.

Investors Turning Toward “Offense”

Investors are rotating into offensive sectors such as Technology and Consumer Discretionary and moving away from traditionally “safe” areas like Utilities and Staples. This is an indication that investors are feeling more confident.

News of lower tariffs between the U.S. and China has eased fears, which is reflected in the performance of bellwether industries such as Home Builders, Transportation, and Retail. The SPDR S&P Retail ETF (XRT) took a big hit on the possibility of high tariffs but bounced in early April. This week, the ETF gapped up and is now trading above its 200-day SMA (see chart below).

FIGURE 3. DAILY CHART OF SPDR S&P RETAIL ETF (XRT). After getting hammered, XRT is showing signs of recovery. The stock is now gaining some traction. It’s trading above its 200-day SMA, and momentum is strengthening.Chart source: StockCharts.com. For educational purposes.

XRT’s relative strength index (RSI) is rising above 70 and the percentage price oscillator (PPO) is well above zero. Both indicators suggest a rise in momentum.

A Word of Caution: Consumers Are Still Nervous

Amidst the excitement, we can’t ignore one concerning signal: consumer sentiment.. The latest reading of the University of Michigan’s consumer sentiment index came in at 50.8, which is pretty close to the June 2022 reading of 50, when inflation was over 9%.

Results showed that consumers are worried about inflation — the expectation was a high 7.3%. Walmart (WMT) executives even mentioned during its recent earnings call that higher tariffs might lead to price increases. This is something to keep in the back of your mind because, when consumer sentiment weakens, it could ripple through the stock market.

Inflation expectations are starting to climb higher. The probability of the interest rate cuts has dropped, according to the CME FedWatch tool. Cuts in June and July are off the table now. The chart below is worth adding to one of your ChartLists.

FIGURE 4: INFLATION EXPECTATIONS ARE CREEPING HIGHER. It’s worth monitoring this chart because higher prices lead to less consumer spending and declining consumer confidence. This can be a headwind for equity markets.Chart source: StockCharts.com. For educational purposes.

The Bottom Line

When the stock market reverses course as quickly as it did this week, it doesn’t hurt to be skeptical. Before getting caught up in the euphoria, keep an eye on things like offensive vs defensive sector rotation, market breadth indicators, and key fundamentals such as inflation expectations. If inflation heats up again, the Fed will be reluctant to cut interest rates. This is the kind of thing that can put the brakes on a market rally.


End-of-Week Wrap-Up

  • Dow Jones Industrial Average: 42,654 (+ 3.41%)
  • S&P 500: 5,958.38 (+ 5.27%)
  • Nasdaq Composite: 19,211 (+7.15%)
  • $VIX: 17.24 (-21.28%)
  • Best performing sector for the week: Technology
  • Worst performing sector for the week: Health Care
  • Top 5 Large Cap SCTR stocks: Palantir Technologies, Inc. (PLTR); Nebius Group NV (NBIS); NRG Energy, Inc. (NRG); Robinhood Markets Inc. (HOOD); Super Micro Computer, Inc. (SMCI)

On the Radar Next Week

  • May PMI Flash
  • April Existing Home Sales
  • Earnings from Home Depot (HD), Lowe’s Companies (LOW), Toll Brothers, Inc. (TOL), XPeng Inc. (XPEV), Snowflake (SNOW), Baidu Inc. (BIDU), and several others.
  • Fed speeches from Bostic, Jefferson, Williams, and others.

Disclaimer: This blog is for educational purposes only and should not be construed as financial advice. The ideas and strategies should never be used without first assessing your own personal and financial situation, or without consulting a financial professional.
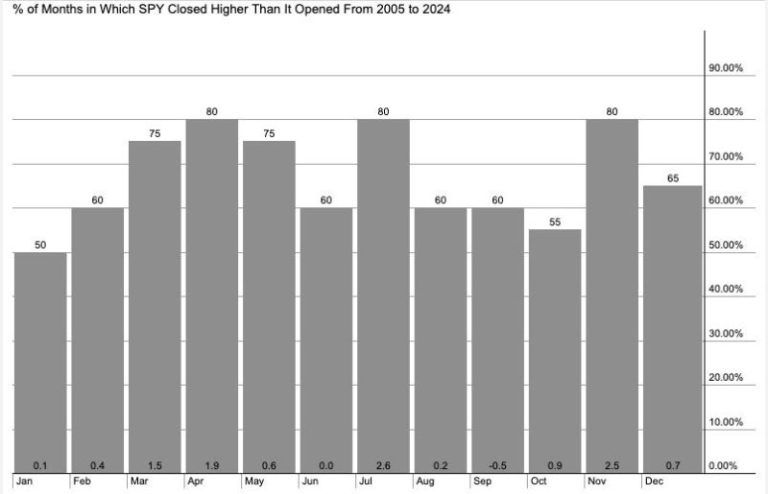
We’ve all heard the classic market maxim, “Sell in May and go away.”  For many investors, that’s the introduction to market seasonality that suggests a six month period where it’s just best to avoid stocks altogether.

Through my own experience, complemented with interviews with seasonality experts like ”  We’ll dig deeper into the history of “Sell in May,” analyze summer trends in recent years, and focus on signs to follow in the weeks and months ahead!  Sign up HERE for this free event!


It turns out that the reason why “sell in May” has often worked out is less about May being super weak, but more about how major lows have usually come in the fall months.  Since the COVID low in early 2020, we’ve experienced major lows in September or October every year except for 2024.

Spring and Early Summer Have Been Crazy Strong

When we focus on the last five years, we can see that the May-June-July period has been consistently strong.  In fact, May and July have seen bullish trends every year since 2019.  So while investors often talk about the “summer doldrums” and weakness into the hot summer months, the recent evidence would suggest otherwise.

The weakest months since the COVID low have actually been January, February, September, and October.  So again, it’s been less about weakness in the spring, and much more about weaker price action into the traditional low in September or October.  Also note the strength in November, where the market is almost always rallying off a major low and setting up for a positive finish to the calendar year!

Will 2025 Follow the Normal Seasonal Pattern?

As I mentioned earlier, I like to think of seasonal patterns as tendencies.  There is no guarantee that July will be strong, and there is no way I can tell you for sure that the market will make yet another major low in September.  Seasonality tells you the general bias to the markets, but mindful investors know the most important evidence is price itself.

Given the extreme rally off the early April low, we’ve seen a rapid rotation from bearish sentiment to more bullish outlooks as investors have started to believe in the new uptrend phase.  This week’s price gap higher for the S&P 500 could provide a perfect support range to monitor in the coming weeks and months.

If the S&P 500 is able to hold 5750, and remain above the support range set from the gap earlier this month, then perhaps the equity markets will follow the same pattern as recent years and remain strong into August.

If, however, the S&P 500 is unable to hold this key support range, and we also confirm that breakdown with weaker momentum readings and deteriorating breadth conditions, then the S&P 500 may be charting a new course through what has become a strong period in the calendar year.

RR#6,

Dave

PS- Ready to upgrade your investment process?  Check out my free behavioral investing course!

David Keller, CMT

President and Chief Strategist

Sierra Alpha Research LLC

marketmisbehavior.com

https://www.youtube.com/c/MarketMisbehavior

Disclaimer: This blog is for educational purposes only and should not be construed as financial advice.  The ideas and strategies should never be used without first assessing your own personal and financial situation, or without consulting a financial professional.  

The author does not have a position in mentioned securities at the time of publication.    Any opinions expressed herein are solely those of the author and do not in any way represent the views or opinions of any other person or entity.

Looking for breakout stocks and top market leaders? Follow along Mary Ellen shares stock breakouts, analyst upgrades, and sector leadership trends to help you trade strong stocks in today’s market.

In this week’s episode, Mary Ellen reveals the stocks leading the market higher and explains what’s fueling their strength. She highlights base breakouts, analyst upgrades, and leadership stocks gaining momentum. In addition, she screens for emerging breakout candidates you should have on your radar.

This video originally premiered May 16, 2025. You can watch it on our dedicated page for Mary Ellen’s videos.

New videos from Mary Ellen premiere weekly on Fridays. You can view all previously recorded episodes at this link.

If you’re looking for stocks to invest in, be sure to check out the MEM Edge Report! This report gives you detailed information on the top sectors, industries and stocks so you can make informed investment decisions.

(TheNewswire)

Vancouver, British Columbia May 16, 2025 TheNewswire Allied Critical Metals Inc. (formerly Deeprock Minerals Inc.) (CSE: ACM) (OTCQB: 0VJ0) (the ‘ Company ‘ or the ‘ Resulting Issuer ‘) is pleased to provide a corporate update as to its updated uses of funds updating the disclosure in its Listing Statement dated April 23, 2025 (the ‘ Listing Statement ‘) which is publicly available under the Company’s profile on SEDAR+ at www.sedarplus.ca, to better reflect the actual results of concurrent financing (‘ Concurrent Financing ‘) of approximately $4.6 million announced by the Company on March 25, 2025 and corresponding updated uses of funds.

The following provides an outline of the Company’s principal purposes of funds, which updates the disclosure in the Listing Statement.

Principal Purposes of Funds

The Company intends to use the funds available to it upon completion of the Company’s transactions (the ‘Transactions ‘) for listing (the ‘Listing’) on the Canadian Securities Exchange (the ‘CSE’) to further its business objectives. Specifically, the Company intends to use the funds available to it following compl etion of the Transactions over the next 12 months as follows:

Use of Proceeds

Estimated Amount
($2.5 million minimum Concurrent Financing)

Estimated Amount
($5.0 million maximum Concurrent Financing)

Resulting Amount
(actual $4.6 million Concurrent Financing)

Variation from maximum $5.0 million Concurrent Financing

Exploration [1]

Borralha – Phase 1

$492,600

$492,600

$492,600

$0

Borralha – Phase 2 [2]

$1,503,200

$1,503,200

$0

Vila Verde – Phase 1 [3]

$226,000

($226,000)

Vila Verde – Phase 2 [4]

$1,066,835

($1,066,835)

Prepayment on 2027 Note [5]

$100,000

$100,000

$100,000

$0

12 months general and administrative costs [6]

$182,000

$182,000

$180,000

($2,000)

Estimated transaction costs [7]

$250,000

$250,000

$250,000

$0

Investor Relation Services [8]

$885,500

$885,500

Additional working capital [9]

$496,035

$231,866

$231,866

Totals:

$1,520,635

$3,820,635

$3,574,811

($245,824)

Notes:

  1. The Exploration is comprised of the recommended work programs for the Borralha Tungsten Project and the Vila Verde Tungsten Project, which are summarized in the Listing Statement. For more detail, please see the Borralha Technical Report and the Vila Verde Technical Report.

  2. Phase 2 of the recommended work program for Borralha was estimated at $1,503,200.

  3. The Company prioritises exploration of Borralha over Vila Verde, but once exploration of Borralha is addressed and if there are sufficient remaining funds then such funds may be allocated towards exploration at Vila Verde, which totals $226,000 for Phase 1 and $1,066,835 for Phase 2. As a portion of drilling expenses are expected to be settled in common shares, the Company expects that there will be sufficient available funds to begin exploration at Vila Verde.

  4. The total cost for Vila Verde’s Phase 2 work program is $2,279,000, but if drilling expenses are partly settled in common shares there may be sufficient funds available to commence Phase 2 of the Vila Verde work program following completion of Phase 1.

  5. On Closing, ACM must pay $100,000 to Pan Iberia as a prepayment of the 2027 Note. The funds available is already net of payment of short term promissory notes, which are paid on Listing and are related to repayment of mineral property license fees and acquisition of the 1% NSR.

  6. The 12 months general and administrative costs are expected to include $35,000 for audit and accounting expenses, $15,000 for regulatory, $45,000 for legal fees, $61,645 for investor conferences marketing fees and expenses, and $23,355 contingency for other general and administrative matters. The budget for management fees ($72,000) was reallocated to Borralha exploration as they pertain to license regulatory expenditure and other work in Portugal in respect of Borralha and the $60,000 budget for legal fees was adjusted to $45,000.

  7. The Transaction costs includes $170,000 legal expenses, $20,000 for the subscription receipt and warrant agent and CDS, $40,000 for CSE listing fees, and $20,000 filing fees and contingency.

  8. Since completion of the Listing, the Company has reallocated $885,500 fixed fees for investor relations services, as described in the Company’s news release dated May 2, 2025. A further amount of up to $15,560 per month variable cost of investor relations was allocated as additional working capital as such services will be terminated to limit costs within budgeted amounts. A discussion of the rationale for the allocation to investor relations services is provided below.

  9. Additional working capital will be deployed towards exploration of Borralha, then Vila Verde, and as working capital for expenses, which may include variable monthly expenses of up to $72,000 for market making ($6,000 per month) and other such expenses for investor relations services.

Prioritizing Borralha Exploration – Rationale for Changes to Uses of Proceeds

As previously disclosed in the Listing Statement (Section 3.3—Resulting Issuer), the Company is prioritizing exploration of Borralha as such exploration enables completion of a preliminary economic assessment( PEA) or prefeasibility study( PFS) for Borralha by the end of summer 2025. In particular, the above use of funds will enable the Company to complete Phase 1 and Phase 2 exploration of Borralha by the end of August 2025. Drilling is expected to commence at Borralha as soon as May 22, 2025.

Borralha is a brownfield past-producing advanced stage, near term production tungsten project which requires a proportionate approach to investor relations to adequately position the Company for the next stage of development. Accordingly, total funds of $885,500 (less than one fifth of the Concurrent Financing) were allocated for investor relations services to sufficiently position the Company’s profile for more significant capital raising following completion of the PEA/PFS this summer to prepare for eventual project financing. Funds allocated to investor relations are aimed at direct interactions with potential capital providers and market participants in the critical metals and tungsten markets to fast track the development and construction the Borralha as a key western source of global tungsten production, highlighting the Company’s profile as particularly well-placed to become a significant leader in global tungsten mineral exploration and development in Portugal. While global macro-economic and political factors are creating an excellent positive environment for the Company with tungsten prices rising 25% from $320/MTU (metric tonne unit) to $400/MTU over the past five months [Source: Fastmarkets, May 2025], tungsten remains a lesser known niche critical mineral in the capital markets community. Accordingly, the Company in consultation with its financial advisors, have developed a strategy to accelerate increased profile recognition in the lead up to completion of its PEA/PFS in the coming months. The Company is excited to begin the next chapter of development of its Borralha and Vila Verde Tungsten Projects and look forward to providing updates as drilling and further exploration progresses over the coming weeks and months.

The Company intends to spend the funds available to it on completion of the principal purposes described above. Nevertheless, there may also be circumstances where, for sound business reasons, a reallocation of funds may be necessary for the Company to achieve its short term and long term objectives. The Company may require additional funds in order to fulfill all of the Company’s objectives, in which case the Company expects to either issue additional shares or incur indebtedness. It is anticipated that the available funds will be sufficient to satisfy the Company’s objectives over the next twelve months.

New CFO

In addition, the Company is pleased to announce Sean Choi as its new Chief Financial Officer who replaces Keith Margetson who has stepped down effective May 14, 2025. The Company greatly appreciates all of Keith’s efforts in completing the Transactions as Chief Financial Officer for the Company since April 2023, and Keith will remain a consultant to the Company to provide assistance as necessary going forward.

Mr. Choi has over 19 years of experience in public accounting and mining industry. During his career, he has served as Chief Financial Officer of Ecuador Gold and Copper Corp. and Northern Sun Mining Corp. which were both reporting issuers listed on the TSX Venture Exchange. He also served as Chief Financial Officer of York Harbour Metals (TSXV: YORK) from April 2014 to June 2024.  Sean is a Chartered Professional Accountant and Chartered Accountant (Ontario) and holds a Bachelor of Administrative and Commercial Studies degree from the University of Western Ontario.

Options and RSUs

The Company also hereby announces the grant of 3,500,000 stock options (the ‘ Options ‘) at an exercise price of $0.22 per share granted to directors, officers, employees and consultants of the Company pursuant to its omnibus equity incentive plan, which vests immediately and expire 5 years after the date of grant. The Company also announces that it has granted 4,097,760 restricted share units (‘ RSUs ‘) to directors, officers, employees and consultants of the Company pursuant to its omnibus equity incentive plan, which vests on September 16, 2025.

The Options and RSUs will be subject to a four month hold period in accordance with applicable Canadian securities laws and the policies of the Canadian Securities Exchange.

ABOUT Allied Critical Metals INC.

The Company is is a Canadian-based mining company focused on the expansion and revitalization of its 100% owned past producing Borralha Tungsten Project and the Vila Verde Tungsten Project in northern Portugal. Tungsten has been designated a critical metal by the United States and other western countries, as they are aggressively seeking friendly sources of this unique metal. Currently, China and Russia represent approximately 90% of the total global supply and reserves. The Tungsten market is estimated to be valued at approximately $5 – $6 billion USD and it is used in a variety of industries such as defense, automotive, manufacturing, electronics, and energy.

Please also visit our website at www.alliedcritical.com.

Also visit us at:

LinkedIn: https://www.linkedin.com/company/allied-critical-metals-inc/

X: https://x.com/@alliedcritical/

Facebook: https://www.facebook.com/alliedcriticalmetalscorp/

Instagram: https://www.instagram.com/alliedcriticalmetals/

CAUTIONARY NOTE REGARDING FORWARD-LOOKING STATEMENTS

This news release contains ‘forward-looking statements’, including with respect to the use of proceeds. Wherever possible, words such as ‘may’, ‘would’, ‘could’, ‘should’, ‘will’, ‘anticipate’, ‘believe’, ‘plan’, ‘expect’, ‘intend’, ‘estimate’, ‘potential for’ and similar expressions have been used to identify these forward-looking statements. These forward-looking statements reflect the current expectations of the Company’s management for future growth, results of operations, performance and business prospects and opportunities and involve significant known and unknown risks, uncertainties and assumptions, including, without limitation, those listed in the Company’s Listing Statement and other filings made by the Company with the Canadian securities regulatory authorities (which may be viewed under the Company’s profile at www.sedarplus.ca ). Examples of forward-looking statements in this news release include, but are not limited to, statements regarding the proposed timeline and terms of the investor awareness campaign, anticipated benefits to Company from running the investor awareness campaign, and the performance of the investor relations services providers of the marketing services as contemplated in the marketing agreements, or at all. Should one or more of these risks or uncertainties materialize or should assumptions underlying the forward-looking statements prove incorrect, actual results, performance or achievements may vary materially from those expressed or implied by the forward-looking statements contained in this news release. These factors should be considered carefully, and prospective investors should not place undue reliance on the forward-looking statements. This list is not exhaustive of the factors that may affect any of the Company’s forward-looking statements and reference should also be made to the Company’s Listing Statement dated April 23, 2025 , and the documents incorporated by reference therein, filed under its SEDAR+ profile at www.sedarplus.ca for a description of additional risk factors. The Company disclaims any intention or obligation to revise forward-looking statements whether as a result of new information, future developments or otherwise, except as required by law.

The Canadian Securities Exchange does not accept responsibility for the adequacy or accuracy of this press release and has neither approved now disapproved the contents of this press release.

ON BEHALF OF THE COMPANY

‘Roy Bonnell’

Chief Executive Officer and Director

For further information, contact:

Dave Burwell

VP Corporate Development

¿¿ daveb@alliedcritical.com

¿¿ 403-410-7907

Copyright (c) 2025 TheNewswire – All rights reserved.

News Provided by TheNewsWire via QuoteMedia

This post appeared first on investingnews.com

Newly elected Canadian Prime Minister Mark Carney announced his cabinet on Tuesday (May 13). Among his selections was Tim Hodgson, the Member of Parliament from Markham-Thornhill, as the new Minister of Energy and Natural Resources.

Hodgson’s portfolio will involve overseeing Canada’s resource sector. His selection has been seen as a nod to Alberta’s oil and gas sector due to his time serving as a board member of MEG Energy (TSX:MEG,OTC Pink:MEGEF), an oilsands producer based in Calgary.

Hodgson also spent time running Goldman Sachs’ (NYSE:GS) Canadian operations, where he advised the Bank of Canada during Carney’s tenure as the central bank’s governor.

South of the border, the United States Bureau of Labor Statistics released April’s consumer price index (CPI) data on Tuesday, reporting that all-items inflation rose by 0.2 percent on a monthly basis, as did core CPI, which doesn’t include the volatile food and energy categories.

The figures indicate a reversal in the deceleration seen over the past few months. During that time, all-items inflation slowed from a 0.5 percent increase in January to a 0.2 percent gain in February before recording a 0.1 percent decline in March. Similarly, core CPI had slowed to a 0.1 percent increase in March.

On an annualized basis, CPI posted a 2.3 percent increase, down from the 2.4 percent recorded in March. However, core CPI remained steady at 2.8 percent.

Markets and commodities react

In Canada, major indexes were mixed at the end of the week.

The S&P/TSX Composite Index (INDEXTSI:OSPTX) gained 2.07 percent during the week to close at 25,971.93 on Friday, the S&P/TSX Venture Composite Index (INDEXTSI:JX) fell 1.93 percent to 672.84 and the CSE Composite Index (CSE:CSECOMP) shed 0.5 percent to 119.01.

US equities were in positive territory this week, with the S&P 500 (INDEXSP:INX) gaining 2.6 percent to close at 5,958.37, the Nasdaq-100 (INDEXNASDAQ:NDX) rising 2.88 percent to 21,412.91 and the Dow Jones Industrial Average (INDEXDJX:.DJI) adding 1.8 percent to 42,654.75.

The gold price was in decline this week, posting a loss of 3.75 percent, to close Friday at US$3,199.69. The silver price was also down, shedding 1.37 percent during the period to US$32.28.

In base metals, the COMEX copper price fell 2.34 percent over the week to US$4.60 per pound. Meanwhile, the S&P GSCI (INDEXSP:SPGSCI) posted a small gain of 0.31 percent to close at 533.11.

Top Canadian mining stocks this week

How did mining stocks perform against this backdrop?

Take a look at this week’s five best-performing Canadian mining stocks below.

Stock data for this article was retrieved at 3 p.m. EDT on Friday using TradingView’s stock screener. Only companies trading on the TSX, TSXV and CSE with market capitalizations greater than C$10 million are included. Companies within the non-energy minerals and energy minerals sectors were considered.

1. Foremost Clean Energy (CSE:FAT)

Weekly gain: 133.11 percent
Market cap: C$29.88 million
Share price: C$3.45

Foremost Clean Energy is a uranium explorer advancing projects in Saskatchewan’s Athabasca Basin. In 2025, its primary focus has been its Hatchet Lake property, part of its Eastern Athabasca projects. The site consists of nine mineral claims within two blocks covering an area of 10,2012 hectares and has seen exploration dating back to the 1960s.

Foremost announced in October 2024 that it had completed the first phase of an option agreement with Denison Mines (TSX:DML,NYSEAMERICAN:DNN) to acquire a 20 percent stake in 10 uranium properties, including Hatchet Lake, in exchange for 1.37 million common shares. Under the terms of the agreement, Foremost can earn up to a 70 percent stake in the properties in exchange for meeting certain milestones within 36 months.

Shares in Foremost have gained after making several positive exploration announcements over the past few weeks.

On May 1, Foremost announced a new uranium discovery at Hatchet Lake based on initial results from an ongoing inaugural drill program. The company said the discovery includes multiple intervals of mineralization, highlighting one grading 0.22 percent equivalent U3O8 over 0.9 meters, including two intersections of 0.1 meters grading 0.58 percent and 0.5 percent.

Follow up information from the program was released on Thursday (May 15) when Foremost reported anomalous radioactivity was detected in 6 out of 10 completed drill holes. After receiving the preliminary results, the company expanded its program from the original eight hole, 2,000 meter program to a 10 hole, 2,400 meter program. Assay results remain pending.

2. Anfield Energy (TSXV:AEC)

Weekly gain: 50 percent
Market cap: C$10.27 million
Share price: C$0.09

Anfield Energy is a uranium and vanadium development company working to advance several projects in the United States.

Among them is its Velvet-Wood project located in Lisbon Valley, Utah, a region with historic uranium exploration and production. The site itself hosts underground infrastructure that was used to recover approximately 4 million pounds of uranium oxide between 1979 and 1984.

According to a January 2023 preliminary economic assessment, the site hosts a measured and indicated resource of 4.64 million pounds of uranium oxide equivalent from 811,000 metric tons of ore at an average grade of 0.29 percent, as well as an inferred resource of 8.41 million pounds of uranium oxide equivalent from 1.84 million metric tons at 0.24 percent.

The report also showed an inferred vanadium oxide resource of 54.4 million pounds from 2.65 million metric tons of ore at an average grade of 1.03 percent.

Shares in Anfield gained this week after it announced on Tuesday that the US Department of the Interior selected Velvet-Wood for expedited environmental permitting as part of the government’s FAST-41 initiative to bolster domestic mineral production. Under the expedited process, the Bureau of Land Management has been directed to complete its review of the project within 14 days.

3. Roscan Gold (TSXV:ROS)

Weekly gain: 44.44 percent
Market cap: C$30 million
Share price: C$0.065

Roscan Gold is an exploration and development company working to advance its Kandiole gold project in the Republic of Mali. The company’s permits cover an area of 288.8 square kilometers and host several mineralized targets.

Kandiole hosts an indicated mineral resource of 1.02 million ounces of gold from 27.4 million metric tons at an average grade of 1.2 grams per metric ton (g/t) gold, and an inferred resource of 200,000 ounces from 5.2 million metric tons at 1.2 g/t.

Roscan has focused on de-risking its project as it moves towards obtaining a mining permit, and spent much of 2024 raising funds. The latest funding announcement came in October 2024 when Roscan closed a non-brokered private placement for gross proceeds of C$2 million. At the time, the company said it would use the funds for general working capital and exploration and development at the Kandiole project.

The most recent news release from Roscan came on March 10 when it welcomed an announcement by the Government of Mali that lifts the partial suspension of the processing of mining license applications. The company said the decision marks a milestone for de-risking the Kandiole gold project.

License applications in Mali had been suspended since 2022. At the time, the military government, which took power in 2021, said the action was to improve the issuance process and better serve the industry.

4. Baru Gold (TSXV:BARU)

Weekly gain: 44.44 percent
Market cap: C$19.55 million
Share price: C$0.065

Developer Baru Gold is advancing its Sangihe gold project in Indonesia. The company holds a 70 percent stake in the 42,000 hectare project, with the remaining 30 percent interest held by three Indonesia-based companies.

Baru Gold is progressing toward approval of its production operations plan, which was redesigned due to the significant macroeconomic shift and increase in the gold price since its last resource estimate in May 2017.

On February 14, the company published a technical report with an updated resource estimate. The resource estimate demonstrates an indicated resource of 114,000 ounces of gold and 1.93 million ounces of silver from 3.15 million metric tons of ore with grades of 1.12 g/t gold and 19.4 g/t silver. The project also hosts an inferred resource of 91,000 ounces of gold and 1.08 million ounces of silver from 2.3 million metric tons of ore with grades of 1.22 g/t gold and 14.5 g/t silver.

The update marks a significant step toward government approval for production operations status, with the only remaining requirement being the payment of taxes.

On Thursday, Baru announced it entered into an arm’s length binding preliminary collaboration agreement with Quantum Metal Thailand, a gold ecommerce platform, which would invest up to US$100 million in Baru as part of an offtake and funding collaboration. Baru said the funding would be used to enhance its gold production and refining capacity to a purity rate of 99.99 percent.

Under the terms of the potential deal, funding would be broken down into an initial investment worth up to US$30 million, and subsequent tranches worth US$10 million. Baru will repay the amount with refined gold based on the London Bullion Market Association gold price, with the first tranche discounted at 30 percent and remaining tranches discounted at 20 percent.

Once production commences, Quantum will also receive 20 percent of the company’s monthly refined gold production until the investment is fully repaid.

5. Talon Metals (TSX:TLO)

Weekly gain: 42.86 percent

Market cap: C$140.21 million
Share price: C$0.15

Talon Metals is an exploration and development company working to advance its Tamarack North polymetallic project in Minnesota, US. Talon owns a 51 percent stake in the 31,000 acre project, with Rio Tinto (ASX:RIO,NYSE:RIO,LSE:RIO) owning the remaining 49 percent.

A technical report released in November 2022 reported a total indicated resource of 8.56 million metric tons of ore at an average grade of 1.73 percent nickel and 0.92 percent copper, 0.05 percent cobalt, 0.34 g/t platinum, 0.21 g/t palladium and 0.15 g/t gold.

Talon has been working through 2024 and 2025 to expand the resource at the project. On May 1 the company announced the highest grade intercept encountered at Tamarack: 8.25 meters at 12.62 percent nickel, 13.88 percent copper, 0.12 percent cobalt, 4.7 g/t palladium, 7.08 g/t platinum, 6.17 g/t gold and 44.31 g/t silver.

The company followed up with further significant news on Monday (May 12), announcing a drill hole encountered 34.9 meters of cumulative massive nickel mineralization over a total length of 47.33 meters.

Brian Goldner, Talon’s chief exploration and operations officer, commented, “In my 19 years working on the Tamarack Project, I’ve never seen anything like this. This 34.9 meter intercept of high-grade massive sulphide isn’t just the longest ever recorded at Tamarack, it’s a defining moment.”

FAQs for Canadian mining stocks

What is the difference between the TSX and TSXV?

The TSX, or Toronto Stock Exchange, is used by senior companies with larger market caps, and the TSXV, or TSX Venture Exchange, is used by smaller-cap companies. Companies listed on the TSXV can graduate to the senior exchange.

How many mining companies are listed on the TSX and TSXV?

As of February 2025, there were 1,572 companies listed on the TSXV, 905 of which were mining companies. Comparatively, the TSX was home to 1,859 companies, with 181 of those being mining companies.

Together the TSX and TSXV host around 40 percent of the world’s public mining companies.

How much does it cost to list on the TSXV?

There are a variety of different fees that companies must pay to list on the TSXV, and according to the exchange, they can vary based on the transaction’s nature and complexity. The listing fee alone will most likely cost between C$10,000 to C$70,000. Accounting and auditing fees could rack up between C$25,000 and C$100,000, while legal fees are expected to be over C$75,000 and an underwriters’ commission may hit up to 12 percent.

The exchange lists a handful of other fees and expenses companies can expect, including but not limited to security commission and transfer agency fees, investor relations costs and director and officer liability insurance.

These are all just for the initial listing, of course. There are ongoing expenses once companies are trading, such as sustaining fees and additional listing fees, plus the costs associated with filing regular reports.

How do you trade on the TSXV?

Investors can trade on the TSXV the way they would trade stocks on any exchange. This means they can use a stock broker or an individual investment account to buy and sell shares of TSXV-listed companies during the exchange’s trading hours.

Article by Dean Belder; FAQs by Lauren Kelly.

Securities Disclosure: I, Dean Belder, hold no direct investment interest in any company mentioned in this article.

Securities Disclosure: I, Lauren Kelly, hold no direct investment interest in any company mentioned in this article.

This post appeared first on investingnews.com

As the global energy transition accelerates, the mining sector is increasingly navigating a complex landscape of shifting demand, volatile prices and growing sustainability priorities.

During an S&P Global webinar on the state of the mining industry in Q1, analysts highlighted renewable power development and mine-site electrification as key sustainability drivers shaping the future of resource extraction.

Copper, a key component of the energy shift, remains a focal point, with average prices holding at US$9,412 per metric ton in the first quarter, though forecasts suggest a slight decline to US$9,317 by year end.

Meanwhile, the battery metals space continues to feel the squeeze.

Lithium prices slumped to US$9,000 per metric ton, leaving an estimated 27 percent of producers operating at a loss, according to S&P. Cobalt held above US$14 per pound, bolstered by the Democratic Republic of Congo’s export ban.

Nickel, driven by surging Indonesian output, is forecast to fall to US$15,730 per metric ton.

The webinar also touched on broader sector dynamics, including ongoing trade tensions, subdued financing activity and an uptick in M&A as companies reposition for long-term growth amid tightening supply and geopolitical uncertainty.

Copper supply disrupted, green demand bolstered

As mentioned, copper prices are expected to dip slightly to US$9,317 by year end.

While positive drivers like a weaker US dollar and resilient Chinese demand are offering some support, refined production cuts, bad weather in Chile and smelter challenges have added pressure to the global supply chain.

Notably, production disruptions in Chile — including a national blackout and Glencore’s (LSE:GLEN,OTC Pink:GLCNF) partial suspension at Altonorte — along with declining US consumer confidence, have led S&P to revise its US refined copper demand growth forecast down to just 1.5 percent for the year. Meanwhile, tightness in the concentrate market has sent spot treatment charges to record lows, amplifying strain on smelter margins.

“(A) developing demand driver for copper is the increasing demand from the green energy transition,’ said Naditha Manubag, associate research analyst, metals and mining research, at S&P Global Commodity Insights.

‘Despite the intensifying US-China trade disputes, copper demand in China has shown resilience, with copper concentrate imports growing by 10 percent in Q1 and cathode imports increasing month-over-month.’

Lithium, cobalt and graphite markets under pressure

In contrast, the battery metals space continues to reel from oversupply and weak pricing. Lithium carbonate CIF Asia dropped to just US$9,000, the lowest level seen since 2021.

“Overcapacity will continue to limit lithium prices until the next decade,” said Manubag. “With this, we have lowered the lithium carbonate CIF Asia price in 2025 to US$9,031. And using this price assumption, 27 percent of lithium operations will be loss-making on a total cash operating margin basis.”

Prices are expected to dip further to US$8,600 in Q3 before a modest recovery in 2027.

The cobalt market, while supported by the Democratic Republic of Congo’s export ban, is forecast to remain in surplus through 2025, though prices are likely to hold above US$14.

“The Democratic Republic of Congo accounts for over 70 percent of global cobalt mine output, yet its ongoing export ban is unlikely to trigger significant production cuts,” the analyst said, adding that the stockpiled supply is expected to re-enter the market once the ban lifts — supporting a sustained price recovery.

Cobalt hydroxide prices have surged the most since the ban began due to tightening supply, and cobalt prices are expected to remain above US$14 through 2025. However, elevated prices may accelerate the trend toward substituting cobalt in battery chemistries as the lithium market braces for further cuts.

Meanwhile, graphite prices are under pressure despite tightening Chinese export controls.

China’s December export ban on key critical minerals, including gallium and germanium, has prompted tighter scrutiny on graphite exports to the US. With China supplying roughly half of America’s antimony and natural graphite imports, pressure on prices has mounted as Tanzanian supply grows, but export options narrow.

Despite current oversupply, a structural deficit is forecast in the medium to long term.

“Spot prices for natural graphite have come under further pressure,” Manubag said. “(US President Donald) Trump’s Section 232 probes import dependence on processed graphite, supporting US anode projects.”

As such, S&P sees US capacity growing to 236,000 metric tons in 2028.

“We maintain our view that continued high feedstock cost on the synthetic anode supply chain could support fine flake and spherical graphite prices,’ the expert added.

Gold leads Q1 mining M&A

M&A in the mining sector slowed sharply in Q1, with both the number and value of deals declining.

Although gold transactions accounted for 86 percent of total M&A value, overall gold deal value dropped 62 percent quarter-over-quarter to US$4.02 billion. In the lead for the period was Equinox Gold’s (TSX:EQX,NYSEAMERICAN:EQX) planned US$1.87 billion takeover of Calibre Mining (TSX:CXB,OTCQX:CXBMF).

Nickel followed, with MMG’s (OTC Pink:MMLTF,HKEX:1208) US$500 million acquisition of Anglo American’s (LSE:AAL,OTCQX:AAUKF) nickel business, including producing assets like Barro Alto and Codemin.

In copper, the top transaction was Hudbay Minerals’ (TSX:HBM,NYSE:HBM) purchase of Mitsubishi Materials’ (OTC Pink:MIMTF,TSE:5711) remaining stake in the Copper Mountain mine for US$44.3 million.

“Gold deals are expected to continue leading M&A activity as the metal maintains its safe-haven appeal amid global trade uncertainty,” Gian Seblos, associate research analyst, metals and mining research, at S&P Global Commodity Insights, said during this week’s webinar. He added, “Meanwhile, cash-rich producers may drive consolidation in base metals, either to secure future output or diversify amid shifting trade dynamics.”

Capital raised by mining companies surged to US$11.92 billion — doubling from the previous quarter and marking the second consecutive quarter of growth following the US Federal Reserve’s December rate cut. Debt financing jumped to 65 percent of total capital raised, up from 35 percent previously, fueled by a surge in senior debt offerings.

Major mining companies led the charge, raising US$7.57 billion — nearly six times more than Q4 2024.

Juniors saw a 25 percent increase, raising US$3.48 billion. Gold companies captured half of the funding, followed by those focused on base metals (33 percent) and specialty commodities (17 percent).

Regionally, Asia and the Middle East posted a 331 percent gain to US$1.58 billion, primarily driven by Saudi Arabia’s Ma’aden through two non-convertible bond offerings worth US$1.25 billion.

Africa and Europe also saw strong growth, while Australia, Canada and the US experienced declines.

Securities Disclosure: I, Georgia Williams, hold no direct investment interest in any company mentioned in this article.

This post appeared first on investingnews.com

Coinbase Global (NASDAQ:COIN), one of the world’s largest crypto exchanges, has announced an investment in Stablecorp to bring QCAD — a Canadian dollar-denominated stablecoin — to Canadians.

The announcement was made in Toronto at the Blockchain Futurist Conference, where it was presented during a fireside chat by Lucas Matheson, Canada country director at Coinbase, and Alex McDougall, CEO of Stablecorp.

The pair positioned the launch as part of a global shift toward stablecoin integration and digital financial innovation, underscoring Canada’s unique opportunity to carve out a leadership role in the emerging digital currency ecosystem.

‘Stablecoins are probably the topic to draw this year in crypto, for a lot of good reasons,” said Matheson.

“When you look at volume around the world for cryptocurrencies, stablecoins currently account for about 70 percent of all volume in cryptocurrency, while maintaining about 10 percent of the market cap.”

Matheson pointed out that governments around the world, from the US to the UK, are moving quickly to legislate and define these assets as legitimate payment instruments. He stressed that Canada needs to be part of that conversation.

Stablecorp’s QCAD is not new to the scene. McDougall noted that the company has been working since 2020 to create a homegrown stablecoin that reflects Canada’s economic standing. Despite the US dollar’s dominance in the global stablecoin market, McDougall believes the Canadian dollar has a compelling case to make.

“The Canadian dollar trades over C$400 billion a day in foreign exchange. Over C$3.6 billion of goods cross the American border, back and forth every day,’ he told audience members. “There’s over C$316 billion in international central bank reserve currencies, and that’s up to C$65 billion over 2024 — the Canadian dollar quietly kicks ass.’

The Coinbase-Stablecorp partnership aims to fill this void by integrating QCAD into use cases ranging from simple peer-to-peer transactions to institutional finance and global trade. Matheson explained that Coinbase’s backing will bring the reach, trust and compliance capabilities needed to scale QCAD nationally and internationally.

Their discourse also revolved around real-world applications. McDougall described QCAD as a solution that dramatically lowers costs and increases speed in cross-border and domestic payments.

He pointed to practical examples already being piloted, such as Brazilian students paying Canadian tuition fees using QCAD, and Filipino workers receiving remittances via seamless FX-to-stablecoin pipelines.

In both cases, traditional banking systems are circumvented in favor of instant, lower-fee digital rails.

The stablecoin, McDougall added, also opens new doors for small business financing. Canadian businesses will soon be able to draw international lines of credit that settle in QCAD in real-time, with FX baked into transactions, a feature traditional banks currently do not offer. He also highlighted use cases in global telecommunications billing, where cross-border carrier settlements, a US$5 billion annual burden, could be simplified via programmatic stablecoin payments.

Even more futuristically, he envisions QCAD being critical infrastructure for Canada’s artificial intelligence ambitions.

“From just simple everyday things like sending money around and taking that power back, all the way to having these fully automated global webs of commerce — stablecoins are the building blocks for every single one of those,” he said.

Despite the momentum, both Matheson and McDougall acknowledged that Canada’s regulatory environment has not kept pace with innovation. Unlike jurisdictions such as the US and UK, where stablecoins are being defined through legislation as distinct asset classes, often as e-money, Canada remains entangled in a fragmented regulatory landscape.

“Our challenge is that we have 13 different provincial securities regulators, each approaching crypto through the lens of securities law,” said Matheson. “That’s led to a square peg, round hole problem.”

The lack of a unified federal framework has made it difficult for firms like Stablecorp to fully operationalize a compliant and scalable stablecoin solution. However, the panelists hope this may be changing with a cabinet shakeup.

With the QCAD rollout and further announcements expected in the coming weeks, the pressure now shifts to Ottawa to match private sector ambition with public policy action.

Securities Disclosure: I, Giann Liguid, hold no direct investment interest in any company mentioned in this article.

This post appeared first on investingnews.com

Here’s a quick recap of the crypto landscape for Friday (May 16) as of 4:00 p.m. UTC.

Get the latest insights on Bitcoin, Ethereum and altcoins, along with a round-up of key cryptocurrency market news.

Bitcoin and Ethereum price update

Bitcoin (BTC) was priced at US$104,223 as markets closed, up 1 percent in 24 hours. The day’s range for the cryptocurrency has seen a low of US$102,935 and a high of US$104,291.

Bitcoin performance, May 16, 2025.

Chart via TradingView.

Ethereum (ETH) finished the trading day at US$2,592.45, a 1.2 percent increase over the past 24 hours. The cryptocurrency reached an intraday low of US$2,527.33 and saw a daily high of US$2,631.38.

Altcoin price update

  • Solana (SOL) closed at US$171.79, down 0.3 percent over 24 hours. SOL experienced a low of US$168 and a high of US$173.98.
  • XRP is trading at US$2.42, reflecting a slight 1.5 percent decrease over 24 hours. The cryptocurrency reached a daily low of US$2.37 and a high of US$2.50.
  • Sui (SUI) is priced at US$3.87, showing an increaseof 2.0 percent over the past 24 hours. It achieved a daily low of US$3.79 and a high of US$3.94.
  • Cardano (ADA) is trading at US$0.7788, up 0.9 percent over the past 24 hours. Its lowest price of the day was US$0.755, and it reached a high of US$0.7905.

Today’s crypto news to know

Coinbase faces US$400 million fallout after major cyber attack

Coinbase Global (NASDAQ:COIN) disclosed that a sophisticated cyber attack has compromised a portion of its customer base and could cost the firm up to US$400 million.

Hackers reportedly gained access to internal systems by paying off employees and contractors, allowing them to impersonate Coinbase and scam users out of their crypto.

Less than 1 percent of customer data was breached, but the attackers demanded a US$20 million ransom—which Coinbase flatly refused to pay. Instead, the company has pledged to fully reimburse affected users and established a US$20 million reward for information leading to the perpetrators’ arrest.

the timing of the attack is significant, coming just days before Coinbase is set to join the S&P 500 (INDEXSP:.INX), a milestone for mainstream crypto acceptance.

Ripple’s US$50 million SEC settlement rejected by federal judge

A US federal judge has rejected a US$50 million settlement deal jointly proposed by Ripple Labs and the US Securities and Exchange Commission (SEC), calling the motion ‘procedurally improper’ and outside her jurisdiction.

The dispute stems from the SEC’s longstanding lawsuit accusing Ripple of conducting unregistered securities sales through XRP, a case now under appeal. Judge Analisa Torres said that because the litigation is at the appellate stage, the district court has no authority to modify the previous judgment.

Ripple’s chief legal officer responded by emphasizing that the ruling doesn’t affect the company’s earlier court wins and that both sides remain aligned on resolving the issue.

Bitget becomes world’s third top crypto exchange by trading volume

Bitget has officially surged into third place among global crypto exchanges, reporting a stunning US$757.6 billion in futures trading volume and US$68.6 billion in spot volume for April 2025.

The Seychelles-based platform has made a name for itself through features like copy trading, which allows users to mimic high-performing traders in real time. Bitget’s April performance stood out despite a broader market correction, expanding its market share to 7.2 percent and pushing its user base above 120 million.

The exchange’s rise signals increasing demand for advanced crypto trading products beyond the traditional buy-and-hold strategy.

Fifth Third Bank eyes expansion into crypto after regulatory green light

After five years of quietly exploring the crypto space, Fifth Third Bank now says it’s ready to expand its offerings amid friendlier US regulations. The Cincinnati-based lender, which holds over US$200 billion in assets, has been working with crypto firms since 2020 but delayed larger moves until clearer guidance from regulators arrived.

According to Chief Strategy Officer Ben Hoffman, the bank is now exploring stablecoin-powered cross-border payments, crypto payroll services and digital asset custody. Recent signals from the Office of the Comptroller of the Currency and the Trump administration’s pro-crypto stance have given institutions more confidence to act.

Fifth Third has formed internal teams across its business lines to integrate blockchain-based financial products responsibly. With mainstream banks finally stepping into crypto with more certainty, a new chapter of institutional adoption appears to be underway.

US lawmakers debate GENIUS Act as stablecoin regulation nears critical juncture

The GENIUS Act, a bipartisan bill aimed at establishing a regulatory framework for US dollar-backed stablecoins, is under intense scrutiny as lawmakers grapple with its potential implications.

While the legislation seeks to provide clarity and oversight in the burgeoning stablecoin market, recent developments have introduced partisan divisions and raised concerns over consumer protections and financial stability.

Initially enjoying bipartisan support, the GENIUS Act has encountered resistance from Senate Democrats following revelations about former President Donald Trump’s involvement in digital asset ventures.

Lawmakers are now advocating for amendments to enhance consumer protections, enforce stricter financial controls and address potential ethical issues, particularly regarding the participation of large tech companies like Meta in the stablecoin space.

Despite these challenges, Republican proponents of the bill are pushing for its approval by Memorial Day (May 26), emphasizing the need for regulatory clarity to foster innovation and maintain the US dollar’s dominance in the digital economy.

Mastercard teams up with MoonPay to enable stablecoin payments worldwide

Mastercard (NYSE:MA) has announced a major new partnership with crypto payment processor MoonPay to bring stablecoin-based payments to more than 150 million global merchants.

The collaboration leverages Iron, a blockchain infrastructure company recently acquired by MoonPay, to enable real-time spending of stablecoins at any location accepting Mastercard.

The partnership is geared toward gig workers, digital creators and international businesses looking to send or receive money in a faster, cheaper and more flexible way. MoonPay says it already works with over 500 crypto platforms and can now expand its reach to over 100 million active users

Securities Disclosure: I, Giann Liguid, hold no direct investment interest in any company mentioned in this article.

This post appeared first on investingnews.com