Archive

May 14, 2025

Browsing

Let’s be honest. Did anyone think a little more than a month ago that the S&P 500 was primed for a 1000-point rebound? I turned bullish at that April 7th bottom a month ago, but I did not see this type of massive recovery so quickly.

Why does this happen?

I believe these panicked selloffs occur, because the big Wall Street firms get out prior to market massacres and they need to get back in. What’s the best way to accumulate shares? To send out your best market influencers (oops, I meant analysts) to drive home the pain and misery that’s coming. I mean, just ask the media outlets. They were the ones responsible for all those terrorizing headlines. And market makers added panic by opening stocks much, much lower from previous days’ closes on many occasions this year.

Want some evidence?

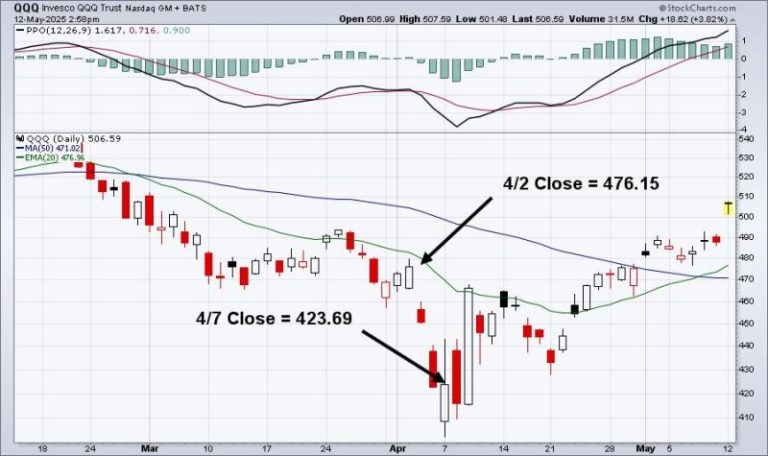
Well, let’s go back in time and zero in on the more aggressive QQQ (ETF that tracks the NASDAQ 100):

At the very bottom, when the most manipulation takes place, we see massive gaps to the downside that create opportunities for Wall Street firms to buy in much, much cheaper as retail traders panic sell into those falling gaps. The massive volume that accompanies capitulation makes it very easy for market makers to buy lots of shares on their own behalf and on behalf of their institutional clients. This institutional buying is reflected by higher prices intraday. Looking at the above chart, the QQQ tumbled 52.46 (476.15-423.69) over 3 trading days. But the total gap downs over those 3 days were 46.26, nearly 90% of the entire 3-day meltdown. This wasn’t a distribution period or a selling event, it was a MARKET MAKER MANIPULATION EVENT.

Want an even more telling stat? From the March 13th close (467.64) to the Friday, May 9th close (487.97), the QQQ gained roughly 20 bucks. Here’s the breakdown of how the QQQ traded on an intraday basis over this 2-month period:

  • Opening gaps: -42.31
  • 9:30-10:00: +19.18
  • 10:00-11:00: +6.72
  • 11:00-2:00: +21.86
  • 2:00-4:00: +14.13

During a period when the QQQ gained roughly 20 bucks, the cumulative opening gaps were -42 bucks. That means that the QQQ saw buying to the tune of 62 bucks during the trading day. Panicked retailers took the market makers’ bait and sold with all the media-related nonsense, while market makers were secretly buying for all their Wall Street colleagues and buddies.

If you’re sitting in cash right now, wondering when to get back in, I can promise you that you’re not alone. This 2025 “massacre” and “shocking rebound” were planned all along. Wall Street’s rotation into defensive areas of the market had me and many EarningsBeats.com members in cash back in January and early February. They absolutely knew this was coming, but media outlets weren’t telling us back then to get out. They waited for the fear to kick in before posting their ridiculously-bearish headlines over and over and over again – forcing retail traders to say “Uncle!!!!!”

This is what I refer to as “legalized thievery.” It’s how our financial system works unfortunately. You either learn how to play defense against it or periodically suffer the consequences. At EarningsBeats.com, we choose the former.

How To Build A Winning Portfolio

Now that the manipulation is in our rear view mirror and the S&P 500 looks to move back into all-time high territory, it’s very important to understand the best way to outperform the benchmark S&P 500. That’s what we strive to do over time and we’ve been very successful at it. This Saturday, May 17th, at 10:00am ET, I’ll be hosting a webinar to show you how to successfully build a portfolio that outperforms over time. One part of this webinar will be dedicated to highlighting the keys to spotting the 2025 cyclical bear market and determining the best time frame to jump back in. We’ve made these calls in real time during 2025, from our MarketVision 2025 event in early January to my Daily Market Reports to EB members to my StockCharts blog articles to my YouTube shows hosted by both EarningsBeats.com and StockCharts.com. It’s extremely important that we learn from difficult periods in the stock market so that we’re better prepared for the next one.

Don’t allow Wall Street to manipulate you. I’m going to show you the best way(s) to avoid it when it occurs again. And it WILL happen again. CLICK HERE to learn more, register for our “How To Build A Winning Portfolio” and save your seat. If you cannot make the event live on Saturday, you’ll receive a recording of the event to listen to at your leisure simply by registering. So register NOW!

Happy trading!

Tom

Bullish signal alert! Over 50% of S&P 500 stocks are now above their 200-day moving average.

In this video, Dave explains this key market breadth indicator and what it means for stock market trends. He shows how moving average breadth has reached a bullish milestone, what this means based on historical signals over the past 15 years, and how it compares to the Zweig Breadth Thrust. He also introduces the stoplight market phase technique—a simple but effective method using StockCharts tools to assess market conditions in real time.

This video originally premiered on May 13, 2025. Watch on StockCharts’ dedicated David Keller page!

Previously recorded videos from Dave are available at this link.

We’ve been cautious about the uptrend phase off the April low for a number of reasons, including the lack of breadth support.  While short-term measures of breadth had turned more positive, the long-term breadth conditions had remained firmly in the bearish realm.  With the renewed strength in risk assets over the last week, our long-term breadth measures now indicate a healthy uptrend phase.  

Today we’ll dive a little deeper into one of those breadth indicators, talk about why we track moving average breadth, and show how this recent bullish signal could be a sign of stronger price action to come.

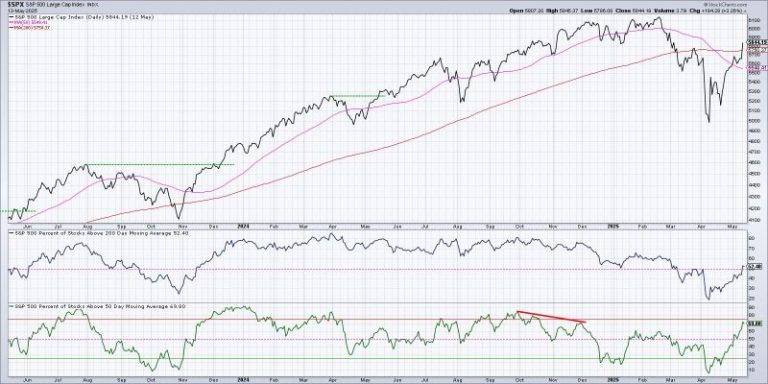
Here we’re showing the S&P 500 on a closing basis along with its 50-day and 200-day moving averages.  Below that, we’re tracking the percent of S&P 500 stocks above their 200-day moving average, followed by the percent of stocks above their 50-day moving average.

Starting at the bottom, we can see that less than 10% of S&P 500 members were above their 50-day moving average at the April 2025 low.  The last time we had reached below the 10% level was back in October 2023, just before a significant market bottom.

While the surge in this short-term breadth indicator over the last month has suggested a tactical rally, the panel above shows how there were still less than 50% of S&P 500 members above their 200-day moving average.  So most stocks had regained the short-term moving average, but were still languishing below the long-term moving average.

As risk assets have surged higher this week, it’s meant enough upside momentum that now most S&P 500 members are back above their 200-day moving average.  Now let’s look at a longer-term time frame and consider previous instances where this long-term moving average breadth indicator has gone from below 25% to above 50%.

We’ve identified eight occurrences of this pattern since the 2009 market low.  In all eight occurrences, the S&P 500 has experienced positive returns in the next 12 months.  And with the exception of the signal in October 2015, we haven’t seen any retest of the previous swing low.

Let’s dig into that 2015 example a little further, and you’ll see what differentiated that particular signal from all the others.

In all the other occurrences, the S&P 500 broke above its 200-day moving average and held that crucial level of support.  In Q4 2015, however, the S&P 500 failed to hold the 200-day moving average, and the breadth indicators soon rotated back to a bearish phase.

It took another attempt in March 2016 before the chart finally resolved to the upside, with the S&P 500 leaving the 200-day moving average behind as it continued to push higher.  Breadth indicators continued to improve as investors began to believe in the bull market of 2016.

I was taught that “nothing good happens below the 200-day moving average,” which also implies that good things can definitely happen above this long-term trend barometer.  At this point, given the bullish breadth rotation that we’ve observed off the April low, I would say that as long as the S&P 500 remains above its 200-day moving average, then we stand a serious chance of further upside from here.

If, however, the SPX fails to hold this crucial line of support, and the index falls back below the 5750 level, then we may be looking at more of a 2015-style retracement as fears rise and stocks drop.

RR#6,

Dave

PS- Ready to upgrade your investment process?  Check out my free behavioral investing course!

David Keller, CMT

President and Chief Strategist

Sierra Alpha Research LLC

marketmisbehavior.com

https://www.youtube.com/c/MarketMisbehavior

Disclaimer: This blog is for educational purposes only and should not be construed as financial advice.  The ideas and strategies should never be used without first assessing your own personal and financial situation, or without consulting a financial professional.  

The author does not have a position in mentioned securities at the time of publication.    Any opinions expressed herein are solely those of the author and do not in any way represent the views or opinions of any other person or entity.

For months, investors have been on edge over U.S.-China tariff tensions, bracing for everything from fears of empty shelves to rising prices. But after this weekend’s trade talks, where both sides agreed to temporary tariff cuts (emphasis on temporary), stocks surged.

On Monday, the Dow Jones Industrial Average ($INDU) jumped 1,160 points, while the S&P 500 ($SPX) and Nasdaq Composite ($COMPQ) rallied 3.26% and 4.35%, respectively.

Monday’s rally sparked hopes that the worst may be over. Yet analysts remain split: some see signs of a bottom, while others warn this 90-day pause is just the start of a long, messy negotiation.

So here’s the critical question: If this is the bottom, which sector (or industry) leads the rebound, and is it worth investing in it right now? For investors, the answer could be the difference between riding the next bull wave or watching it pass by.

Nasdaq-100 Shows Strength, but Which Sector Leads?

Checking StockCharts’ Market Summary midday on Monday, the Breadth panel showed that the tech-heavy Nasdaq 100 ($NDX) had the most percentage of stocks (62%) trading above their 200-day simple moving average (SMA), indicating early strength and recovery (displayed in the Moving Averages tab).

FIGURE 1. MARKET SUMMARY – INDICES TRADING ABOVE 20 TO 200-DAY MOVING AVERAGES. The Nasdaq 100 is the most bullish index above the 200-day, warranting a closer examination.

About 51% of the Nasdaq 100 is made up of Information Technology stocks, while Consumer Discretionary and Communication Services together account for roughly 31% of the index.

Information Technology Dominates the Index

To get a clearer sense of market breadth, it’s useful to examine the sector-level Bullish Percent Index (BPI), which shows the percentage of stocks within each sector exhibiting technical strength.

FIGURE 2. MARKET SUMMARY SECTOR BULLISH PERCENT INDEX. While many sectors have bullish BPIs, the tech sector is leading.

While Communications and Discretionary are exhibiting technical strength, the Information Technology sector is leading the pack, with over 91% of stocks triggering Point & Figure buy signals.

Semiconductors: The Bellwether to Watch

While tech is also comprised of various industries, only one—semiconductors—is widely regarded as a “bellwether” industry. Shifting over to the US Industries panel, semiconductors displayed the highest StockCharts Technical Rank (SCTR).

FIGURE 3. BELLWETHER INDUSTRY SCTR SCORES. Among the bellwether industries listed, chipmakers are outpacing everything else.

While my threshold for bullish SCTR reading is 76, the semiconductor industry is the only bellwether industry that clears that bar.

But what might the performance of the Nasdaq 100, semiconductor, and broader market performance look like side by side? To answer this question, I plotted all three on a one-year PerfCharts view.

 FIGURE 4. PERFCHARTS OF SEMICONDUCTORS, NASDAQ 100, AND THE S&P 500. Here, semiconductors aren’t looking so hot, being the laggard of the bunch.

Using VanEck Vectors Semiconductor ETF (SMH) as the industry proxy, you can see that SMH was leading the Nasdaq 100 and S&P 500 last summer, but began lagging the two indexes starting in November. SMH was the hardest hit in the aftermath of the Trump tariffs, and, while it’s recovering, its performance is still trailing both indices.

This raises two key questions: First, is SMH’s upswing a true recovery or a temporary bounce? And second, is it worth investing in SMH in this stage of the cycle (in other words, does it present an opportunity to catch an uptrend early on)?

Weekly Chart Signals: Bear Market Drop or Recovery?

Let’s take a closer look at SMH, starting with a weekly chart.

FIGURE 5. WEEKLY CHART OF SMH. From a primary trend perspective, one that can last years, the uptrend is arguably intact, though facing challenges.

Here are the key points to look at:

  • SMH is trading above the 40-week SMA (equivalent to a 200-day SMA) following a sharp price gap up. But can it hold above that level?
  • SMH plunged 39.8% from its 2024 high of around $280 to the 2025 low of $170. This is a textbook bear market drop that raises the question: Is this latest surge just a bear market rally?
  • On the other hand, a long-term Fibonacci Retracement measured from the 2022 low to the 2024 high found support at the 50% and 61.8% retracement levels. This kind of pullback is not only “normal”, but also supports the view that SMH’s bullish “primary trend” is still intact.
  • However, the Chaikin Money Flow (CMF) is signaling weak buying pressure. For the rally to continue, there needs to be stronger accumulation, something the CMF has yet to confirm.

Daily Chart View: Support, Resistance, and Warning Signs

After looking at SMH from a broader scale, what might the price action reveal if we were to zoom in using a daily chart?

FIGURE 6. DAILY CHART OF SMH. Zooming in, SMH’s situation looks even less bullish.

This chart tells a tougher story: SMH looks ready to re-enter the months-long trading range it broke to the downside in March.

Should You Invest In SMH? Here’s What to Watch

To answer this question, here’s some points you might want to focus on:

For one, note how closely the stochastic oscillator cycles mirror SMH’s fluctuations. With a reading above 96, SMH may be due for a near-term pullback.

Should it pull back, SMH will need to remain above or bounce at the $210 support range (highlighted in blue) for the current, albeit small, uptrend to remain intact. Below that, it might bounce at the consecutive swing lows—$185 and $170—but such a deep pullback indicates weakness and raises the possibility that SMH may slip back into the trading range (highlighted in yellow) that dominated a lengthy five-month period.

On the upside, SMH needs to eventually clear that same range before challenging its all-time highs at the $281 level. If SMH manages to do so, it’s likely to unfold in a series of higher highs and higher lows, which will take some time to develop.

At the Close: A Bullish Setup or Bull Trap?

While SMH has begun to exhibit significant technical strength, warning signs remain. If you’re bullish on semiconductors, the next few weeks will be critical. Holding the $210 support zone is key for keeping the uptrend intact. A drop toward $185 or $170 would raise serious doubts about the sustainability of the current rally.

If SMH can clear its trading range and build a structure of higher highs and higher lows, it could be poised to challenge its all-time highs once again. Until then, stay cautious and keep a close eye on the technical levels discussed above.


Disclaimer: This blog is for educational purposes only and should not be construed as financial advice. The ideas and strategies should never be used without first assessing your personal and financial situation, or without consulting a financial professional.

(TheNewswire)

May 13, 2025 – TheNewswire – Vancouver, British Columbia, Canada JZR Gold Inc. (TSXV:  JZR) (OTCQB: JZRIF) (the ‘ Company ‘ or ‘ JZR ‘) wishes to provide an update on operations at Vila Nova Gold Project (the ‘ Vila Nova Project ‘ or the ‘ Property ‘) located in the state of Amapa, Brazil.

ECO Mining Oil & Gaz Drilling Exploration EIRELI (‘ ECO ‘), the operator of the Vila Nova Project, commissioned the design, manufacture and installation of a gravimetric mill on the Property capable of processing up to 800 tonnes per day.  ECO has advised the Company that testing of the mill has been completed and that the mill is fully operational. ECO has further indicated that it expects that the mill will commence operating on a limited basis as technical personnel are currently being trained to operate the mill, and processing material is being transported to the mill site. The Company has been advised that the Vila Nova Project is fully permitted, at the State and Federal level.

The Company possesses a 50% net profit interest in all net profit generated from the Vila Nova Project pursuant to a Joint Venture Royalty Agreement with ECO dated July 6, 2020, as amended on January 9, 2023.

The Company is also pleased to announce that it has appointed Mr. Sonny Janda to the board of directors. Mr. Janda has been involved with and brings experience from notable positions with Canadian publicly traded companies. He is a director and Executive Chairman of Desert Gold Ventures Inc., a precious metal exploration and early development mining company.  He is also a director of Sierra Grande Minerals Inc., a North American focused exploration company, and a director of Grand Peak Capital Corp.

Mr. Janda currently serves as CEO and Director of the Janda Group®, a diversified family-owned business.  The Janda Group® develops various types of real estate assets including master-planned mixed-use communities, high density residential and agricultural projects. Mr. Janda earned a Bachelor’s Degree in economics from Simon Fraser University.

‘JZR’s board and management are very pleased to welcome Sonny Janda to the Company’s board of directors. Mr. Janda’s knowledge and experience will strengthen the board and assist in our growth.’, commented Robert Klenk, Chief Executive Officer of JZR.

For further information, please contact:

Robert Klenk

Chief Executive Officer

rob@jazzresources.ca

Forward-Looking Statements

This news release contains forward-looking statements, which includes any information about activities, events or developments that the Company believes, expects or anticipates will or may occur in the future.  Forward-looking statements in this news release include statements with respect to the anticipated start-up of the Mill and the planned commencement of bulk sampling on the Property.  Forward-looking statements are subject to a variety of known and unknown risks, uncertainties and other factors that may cause the actual results, level of activity, performance or achievements of the Company to be materially different from those expressed or implied by such forward-looking statements.  Risks that could change or prevent these statements from coming to fruition include, but are not limited to, that ECO may not succeed in bringing the Mill into operation and that the Mill may not operate as anticipated, or at all; that any minerals which may exist on the Property may not be economically mined or processed, if at all; that ECO may not be able to obtain the necessary permits related to the Mill or the Property to enable it to explore for, or mine or process minerals; that ECO may not be able to raise additional or sufficient funds that may be necessary to develop the Property or bring the Mill into operation and to continue its operation; the availability, or lack thereof, of labour, equipment and markets to develop or sell any products derived from the Property; and general business, economic, competitive, geopolitical and social uncertainties and regulatory risks.  Although the Company has attempted to identify important factors that could cause actual results to differ materially from those contained in forward-looking information, there may be other factors that cause results not to be as anticipated, estimated or intended.  There can be no assurance that such information will prove to be accurate, as actual results and future events could differ materially from those anticipated in such statements.  Accordingly, readers should not place undue reliance on forward-looking statements. The forward-looking statements contained in this news release is expressly qualified in its entirety by this cautionary statement. The Company does not undertake to update any forward-looking statements, except as required by applicable securities laws.

Neither the TSX Venture Exchange nor its regulation services provider (as that term is defined in the policies of the TSX Venture Exchange) accepts responsibility for the adequacy or accuracy of this press release.

NOT FOR DISTRIBUTION TO U.S. NEWSWIRE SERVICES OR FOR RELEASE, PUBLICATION, DISTRIBUTION OR DISSEMINATION, DIRECTLY OR INDIRECTLY, IN WHOLE OR IN PART, IN OR INTO THE UNITED STATES.

Copyright (c) 2025 TheNewswire – All rights reserved.

News Provided by TheNewsWire via QuoteMedia

This post appeared first on investingnews.com

The US and China agreed on Monday (May 12) to pause the majority of their tariffs for a period of 90 days, marking a significant de-escalation in trade tensions between the two countries.

The US will reduce its tariffs on most Chinese goods from 145 percent to 30 percent; meanwhile, China will lower its tariffs on US goods by a similar amount, dropping them from 125 percent to 10 percent.

In addition to the suspension of tariffs, a number of non-tariff measures will be suspended or reversed. These include removing rare earths export restrictions and taking some US tech and defense firms off trade blacklists.

The US will maintain a 20 percent tariff geared at pressuring China to curb the flow of fentanyl to the US. The other 10 percent is the baseline levy that the US has imposed on imports from most nations.

The Trump administration also said the lower tariff rate won’t apply to automobiles, steel and aluminum.

The deal is expected to bring a resumption of shipments to west coast port cities like Los Angeles and Seattle. Recent data indicates a significant reduction in activity as tariffs have pushed the price of goods beyond what many importers can afford. Port activity has dropped to levels not seen since the COVID-19 pandemic disrupted global supply chains.

Although the tariff pause is only temporary, the 90 day break will give the countries time to negotiate a more permanent deal and mitigate a growing trade war that began shortly after Donald Trump assumed the presidency in January.

‘Now, while the 90-day pause is a big step towards easing tensions, it’s crucial to remember that it doesn’t guarantee a complete resolution of the trade war,’ he explained.

‘Once those 90 days are up, everyone will be keeping a close eye on what happens next, especially the results of ongoing negotiations and whether the tariffs will be permanently cut or brought back.’

Market response was mixed on Tuesday (May 13), with the S&P 500 (INDEXSP:INX) jumping 0.9 percent to reach 5,896 points in morning trading and the Nasdaq-100 (INDEXNASDAQ:NDX) surging 1.75 percent to 21,231 points. The Dow Jones Industrial Average (INDEXDJX:.DJI) went the opposite direction, shedding a half percent to 42,216 basis points.

The gold price fell as low as US$3,208.80 per ounce on Monday, a drop of more than US$100 compared to last week’s closing price. It regained some ground on Tuesday and was trading in the US$3,250 range by 1:00 p.m EDT.

The silver price also saw an immediate decline on Monday, but was trading in the US$33 per ounce range on Tuesday.

Securities Disclosure: I, Dean Belder, hold no direct investment interest in any company mentioned in this article.

This post appeared first on investingnews.com

Former Olympic cyclist and world champion Rohan Dennis received a suspended sentence on Wednesday over what was termed a “tragic accident” that led to the death of his wife, fellow Olympian Melissa Hoskins.

The 34-year-old Dennis appeared in South Australia District Court after earlier pleading guilty to a charge of committing an aggravated act likely to cause harm.

Dennis was arrested after Hoskins, 32, was struck by his vehicle in front of their home at Medindie in Adelaide’s north on Dec. 30, 2023. Hoskins suffered serious injuries in the crash and died at Royal Adelaide Hospital.

The court was told that the couple had argued over kitchen renovations before Dennis left their home and drove away. The court also heard that Hoskins had jumped onto the hood of the car during the incident. His licence was also suspended for five years.

Dennis on Wednesday was sentenced to one year, four months and 28 days in jail, to be suspended for two years. The sentence was reduced from two years and two months because of his guilty plea and he’s been placed on a two-year good behavior bond.

The offense carried a maximum sentence of seven years in jail but lawyer Jane Abbey asked that her client receive a suspended sentence, which was not opposed by the prosecution.

During sentencing submissions in in April, Amanda Hoskins said her daughter had loved Dennis “and I know that you would never intentionally hurt her.”

“I believe this is a tragic accident. Your temper is your downfall and needs to be addressed,” she said.

Hoskins’ funeral was held in her home city of Perth, Western Australia and a public memorial service was held in Adelaide in February 2024. Dennis attended the service with their two children.

Hoskins competed at the 2012 and 2016 Olympics on the track in the team pursuit and was in the squad that won the 2015 world title. Dennis won two world titles in the road time trial, as well as silver in the team pursuit at the 2012 Olympics and bronze in the road time trial at the Tokyo Olympics.

This post appeared first on cnn.com

A man who spent nearly four decades in a British prison in the killing of a barmaid said he was not angry or bitter Tuesday as his murder conviction was overturned and he was released after being exonerated by DNA evidence.

Peter Sullivan put his hand over his mouth and wept as the Court of Appeal in London quashed his conviction and ordered his freedom after he had spent years fighting to prove his innocence.

Sullivan, who watched the hearing by video from Wakefield prison in northern England, said through his lawyer that he was not resentful and was anxious to see his loved ones.

“As god is my witness, it is said the truth shall take you free,” attorney Sarah Myatt read from a statement outside court. “It is unfortunate that it does not give a timescale as we advance towards resolving the wrongs done to me. I am not angry, I am not bitter.”

He was the longest-serving victim of a wrongful conviction in the U.K., Myatt said.

Sullivan, 68, was convicted in 1987 of killing Diane Sindall in Bebington, near Liverpool in northwest England. He was behind bars for 38 years.

Sindall, 21, a florist who was engaged to be married, was returning home from a part-time job at a pub on a Friday night in August 1986 when her van ran out of fuel, police said. She was last seen walking along the road after midnight.

Her body was found about 12 hours later in an alley. She had been sexually assaulted and badly beaten.

Sexual fluid found on Sindall’s body could not be scientifically analyzed until recently. A test in 2024 revealed it wasn’t Sullivan, defense attorney Jason Pitter said.

“The prosecution case is that it was one person. It was one person who carried out a sexual assault on the victim,” Pitter said. “The evidence here is now that one person was not the defendant.”

Prosecutor Duncan Atkinson did not challenge the appeal and said that if the DNA evidence had been available at the time of the investigation it was inconceivable that Sullivan would have been prosecuted.

Merseyside Police said it reopened the investigation as the appeal was underway and was “committed to doing everything” to find the killer.

The Criminal Cases Review Commission, which examines possible wrongful convictions, declined to refer Sullivan’s case to the appeals court in 2008 because it said testing at the time was unlikely to produce a DNA profile.

A commission spokesperson said that while it made the correct decision based on the evidence at the time, it regretted not identifying the potential miscarriage of justice in its first review.

Sullivan appealed in 2019 without the CCRC’s help and the court turned down his bid in 2021.

But the commission took up the case later that year and was able to use scientific techniques that hadn’t been available during the earlier review to find the DNA that set Sullivan free.

“In the light of that evidence, it is impossible to regard the appellant’s conviction as safe,” Justice Timothy Holroyde said.

Police said the DNA found in the subsequent investigation does not match anyone in a national database. They’ve ruled out as suspects Sindall’s fiancé, members of her family and more than 260 men who have been screened since they reopened the investigation.

Sullivan’s sister, Kim Smith, reflected outside the court on the toll the case had taken on two families.

“We lost Peter for 39 years and at the end of the day it’s not just us,” Smith said. “Peter hasn’t won and neither has the Sindall family. They’ve lost their daughter, they are not going to get her back. We’ve got Peter back and now we’ve got to try and build a life around him again.”

This post appeared first on cnn.com