Archive

May 10, 2025

Browsing

Stocks plunged into early April and surged into early May, suggesting that a “V” reversal is in the making. There are two parts to the V reversal. First, there is the V, which is the plunge and the rebound. Second, there is the breakout move that completes the reversal. SPY fulfilled the V part, but has yet to actually reverse the long-term downtrend.

The chart below shows SPY falling 20% from late February to early April and then surging some 14% into early May. This move created the V as SPY nears the 200-day SMA and the March support break. The blue-pink shading marks broken support turned resistance in the 575-580 area. We also have the 200-day SMA marking resistance here. Thus, SPY is clearly at a moment of truth. A push through 580 would break the 200-day SMA and negate the March breakdown. This would be bullish price action.  

There is more to a V reversal than price action. TrendInvestorPro went back and studied four V reversals over the last 11 years. They all feature capitulation and a sharp V-shaped recovery. However, it is upside participation that holds the key to moving from bear market to bull market. We need to see a significant increase in upside participation and key breadth indicators cross specific thresholds. These indicators include the percentage of stocks above their 200 and 150 day SMAs, and High-Low Percent.

This week TrendInvestorPro produced a detailed report and video analyzing the prior V reversals and the key participation levels to watch. Among other ETFs, this week’s reports featured the Cybersecurity ETF (CIBR), the ARK Fintech Innovation ETF (ARKF), the Utilities SPDR (XLU) Bitcoin ETF (IBIT), Gold SPDR (GLD) and DB Agriculture ETF (DBA). Click here to take a trial and gain full access.

/////////////////////////////////////////

In this insightful session, Grayson introduces the Traffic Light indicator, a unique tool available exclusively on the Advanced Charting Platform (ACP). Amidst the current volatility of the S&P 500, Grayson demonstrates how this indicator can help investors clarify trend directions and make more confident decisions.

This video originally premiered on May 9, 2025. Click on the above image to watch on our dedicated Grayson Roze page on StockCharts TV.

You can view previously recorded videos from Grayson at this link.

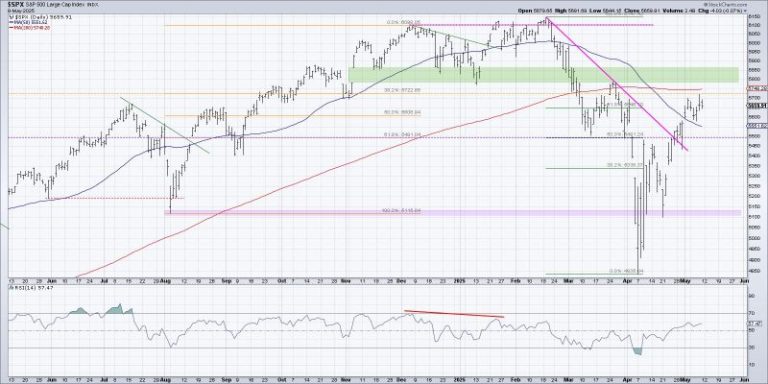
Last Friday, the S&P 500 finished the week just below 5700. The question going into this week was, “Will the S&P 500 get propelled above the 200-day?” And as I review the evidence after Friday’s close, I’m noting that the SPX is almost exactly where it was one week ago!

That’s right–after all the headlines, tariff tantrums, and earnings reports, the S&P 500 ended the week 0.4% below where it started. This “lack of conviction” week led me to post the following poll on X, asking followers to decide which they felt would happen first: a retest of the February 2025 high or a retest of the April 2025 low.

I was actually quite surprised that there wasn’t more optimism after April’s incredible rally phase, but you can see that 55% of respondents thought the February high around 6150 would be hit first. So unlike the AAII survey’s recent readings, there appear to be more bulls than bears out there.

Based on this week’s extended choppiness, I thought it might be good to revisit an approach called “probabilistic analysis” to consider four potential paths for the S&P 500 between now and late June 2025. Basically, I’ll share four different scenarios, describe the market conditions that would likely be involved, and also share my estimated probability for each scenario.

By the way, we last ran this analytical process on the S&P 500 back in January, and you need to see which scenario actually played out!

And remember, the point of this exercise is threefold:

  1. Consider all four potential future paths for the index, think about what would cause each scenario to unfold in terms of the macro drivers, and review what signals/patterns/indicators would confirm the scenario.
  2. Decide which scenario you feel is most likely, and why you think that’s the case. Don’t forget to drop me a comment and let me know your vote!
  3. Think about how each of the four scenarios would impact your current portfolio. How would you manage risk in each case? How and when would you take action to adapt to this new reality?

Let’s start with the most optimistic scenario, with the S&P 500 index continuing the recent uptrend phase to retest all-time highs by June.

Option 1: The Super Bullish Scenario

Our most bullish scenario would mean that the aggressive rally phase off the April low would essentially continue in its current form. After perhaps the briefest of pullbacks at the 200-day moving average, we continue to the upside. This scenario would most likely mean the Magnificent 7 stocks would have to really find their mojo, with names like GOOGL, AAPL, and AMZN finally breaking through their 200-day moving averages.

Dave’s Vote: 10%

Option 2: The Mildly Bullish Scenario

What if the S&P 500 stalls around the 200-day, with a pullback that inspires even more indecision among investors? Perhaps we are still in “wait and see” mode as some tariff negotiations prove fruitful, but empty shipping containers remind consumers of the prospects of chronic inflation.  By mid-June, we’re no closer to a real clear sense of direction than we are today.

Dave’s vote: 30%

Option 3: The Mildly Bearish Scenario

Because of the time frame I’ve selected, there won’t be another Fed meeting until after this period is over. So, what if inflation data starts to imply real price issues, consumer sentiment really starts to falter, and the Fed is unable to take any meaningful action to address mounting concerns? If we fail to push above the 200-day moving average soon, then 5500 would be a likely area of support on the way down.  This scenario brings us right back down to that level.

Dave’s vote: 40%

Option 4: The Very Bearish Scenario

You always need a bear case, and this one would entail a new distribution phase that takes the major benchmarks down to retest the April low. I’d say a reasonable downside objective would be 5100, and we’ll spend the month of June debating whether we’re forming a huge double bottom pattern or see another bounce higher. Defensive sectors shine as investors rotate big time to risk-off positions.

Dave’s vote: 20%

What probabilities would you assign to each of these four scenarios?  Check out the video below, and then drop a comment with which scenario you select and why!

RR#6,

Dave

P.S. Ready to upgrade your investment process? Check out my free behavioral investing course!


David Keller, CMT

President and Chief Strategist

Sierra Alpha Research LLC


Disclaimer: This blog is for educational purposes only and should not be construed as financial advice. The ideas and strategies should never be used without first assessing your own personal and financial situation, or without consulting a financial professional.

The author does not have a position in mentioned securities at the time of publication. Any opinions expressed herein are solely those of the author and do not in any way represent the views or opinions of any other person or entity.

When your investment portfolio isn’t gaining ground, it’s natural to feel uneasy, especially in a market that lacks direction. A headline-driven environment only adds to the uneasiness, making it more difficult to decide whether to buy, hold, or sell.

This is a challenging situation for investors. The S&P 500 ($SPX) is still hovering close to its “Liberation Day” level, struggling to break above it. Of the three major indexes, the Nasdaq Composite ($COMPQ) was able to break above the April 2 levels, but is having a hard time reaching its March 25 high, which, as of this writing, aligns with its 200-day simple moving average (SMA).

What’s Behind the Lack of Direction?

Much of the market’s indecision centers on uncertainty surrounding tariffs. Trade deals are front and center in the news, with the most important one being with China. Those talks kick off this weekend. While President Trump’s suggestion of lowering the tariffs against China from 145% to 80% was a step, stocks didn’t react much. It’s still a very high rate and probably not what investors wanted to hear, and thus the market ultimately closed lower on Friday.

The S&P 500’s recent trading behavior reflects the uncertainty. In the last seven trading days, movement has been muted, a drastic change from the wide-ranging days of early April (see chart below). Of late, any optimistic news gets investors a little upbeat, but the enthusiasm fades quickly. 

FIGURE 1. DAILY CHART OF S&P 500. The last seven days are narrow range days, unlike the wide-ranging days from early April.Chart source: StockCharts.com. For educational purposes

Sector performance isn’t showing clear dominance either. On strong days, Consumer Discretionary, Technology, and Communication Services take the lead. On weaker days, defensive areas like Utilities, Energy, and Consumer Staples step in. This flip-flopping suggests investors lack conviction.

Mid and Small-Caps: Gaining Momentum

The S&P 400 Mid Cap Index ($MID) and S&P 600 Small Cap Index ($SML) posted five straight weeks of gains. This was picked up from the Market Summary page (Equities panel, weekly streak column). This warrants a closer look at these two asset groups.

Mid-cap stocks are showing slight signs of recovery. In the weekly chart of the S&P 400 Mid Cap Index, the index is approaching a near-term resistance level (blue dashed line), the percentage of stocks trading above their 200-day moving average is trending higher, and there’s no consistent move in the Advance-Decline Percent or Advance-Decline Volume Percent.

FIGURE 2. WEEKLY CHART OF S&P 400 MID-CAP INDEX. There are signs of the start of an upside move, but far from confirmed. Chart source: StockCharts.com. For educational purposes.

The weekly chart of the S&P 600 Small Cap Index mirrors the behavior in $MID—$SML is trading above its 10-week simple moving average, the percentage of stocks trading above its 200-day moving average is rising, and there’s a slight increase in the Volume Advance-Decline Percent.

FIGURE 3. WEEKLY CHART OF S&P 600 SMALL CAP INDEX. Similar to the chart in Figure 2, small-cap stocks are also showing slight signs of a potential rally, although it’s a long way away from confirming an uptrend. Chart source: StockCharts.com. For educational purposes.

Mid- and small-cap stocks didn’t participate much in the large-cap Mag 7 bull rally. Maybe things are beginning to look better for these stocks, especially if large-cap growth stocks get bogged down by tariffs.

Looking at the three-month performance across the S&P Sector ETFs, Utilities and Consumer Staples are the best performers, followed by Real Estate and Industrials.

FIGURE 4. THREE-MONTH PERFCHART OF S&P SECTOR ETFS. Consumer Staples and Utilities are the top performers over the last three months, followed by Real Estate and Industrials.Chart source: StockCharts.com. For educational purposes.

If your portfolio leans heavily toward mid- and small-cap stocks, it may be worth monitoring the performance of these groups. These stocks can rally quickly, but can also fade just as quickly. If you’ve been holding on to those stocks for over a decade, a big upside move could offer an opportunity to take profits or re-evaluate your portfolio.

The Bottom Line: Be Prepared

Next week promises a slew of market-moving news: earnings reports, trade deals, and key inflation data. It may be best to stay on the sidelines until the market digests the news. However, if you see a chance to take profits or reduce risk, don’t let them slip away.


End-of-Week Wrap-Up

  • S&P 500 down 0.47% on the week, at 5659.91, Dow Jones Industrial Average down 0.16% on the week at 41,249.38; Nasdaq Composite down 0.27% on the week at 17,928.92.
  • $VIX down 3.44% on the week, closing at 21.90.
  • Best performing sector for the week: Industrials
  • Worst performing sector for the week: Health Care
  • Top 5 Large Cap SCTR stocks: Palantir Technologies, Inc. (PLTR); Duolingo Inc. (DUOL); Robinhood Markets Inc. (HOOD); MicroStrategy (MSTR); Applovin Corp. (APP)

On the Radar Next Week

  • Earnings season continues with several small and mid-cap companies reporting.
  • April Consumer Price Index (CPI)
  • April Producer Price Index (PPI)
  • April Retail Sales
  • Fed speeches from Powell, Jefferson, Daly, and others.

Disclaimer: This blog is for educational purposes only and should not be construed as financial advice. The ideas and strategies should never be used without first assessing your own personal and financial situation, or without consulting a financial professional.

Here’s a quick recap of the crypto landscape for Friday (May 9) as of 9:00 p.m. UTC.

Get the latest insights on Bitcoin, Ethereum and altcoins, along with a round-up of key cryptocurrency market news.

Bitcoin and Ethereum price update

Bitcoin (BTC) was priced at US$103,027 as markets opened, up 1.3 percent in 24 hours. After breaking through the US$100,000 threshold Thursday (May 8) the digital asset has found support. The day’s range has seen a low of US$102,871 and a high of US$103,672.

Bitcoin performance, May 9, 2025.

Chart via TradingView.

Bitcoin’s recent price surge is driven by the US government’s decision to legalize strategic Bitcoin reserves—boosting investor confidence and signaling institutional backing—alongside growing global adoption supported by favorable regulations and broader acceptance across sectors.

Ethereum (ETH) started the trading day at US$2,220 and quickly rallied. The cryptocurrency reached an intraday low of US$1,792.06 and saw a daily high of US$2,415.

Altcoin price update

  • Solana (SOL) opened at US$169.63 up 4.57 percent over 24 hours. SOL experienced a low of US$151.51 and a high of US$171.39.
  • XRP was trading at US$2.33, reflecting a 5 percent increase over 24 hours. The cryptocurrency reached a daily high of US$2.36 midday.
  • Sui (SUI) was priced at US$3.80, showing an increaseof 0.50 percent over the past 24 hours. It achieved a daily low of US$3.36 and a high of US$3.92.
  • Cardano (ADA) is trading at US$0.7866, up 7 percent over the past 24 hours. Its lowest price of the day was US$0.71, and it reached a high of US$0.79.

Today’s crypto news to know

Bitcoin surges past $100,000 amid trade optimism and institutional inflows

Bitcoin (BTC) has reclaimed the US$100,000 mark for the first time since February, driven by optimism surrounding a new US-UK trade deal and significant institutional investments. On May 8, US Bitcoin ETFs saw net inflows totaling US$117.4 million, with BlackRock’s IBIT and Fidelity’s FBTC leading the gains.

Additionally, the Federal Reserve’s decision to hold interest rates steady has bolstered investor confidence in crypto markets.

Coinbase acquires Deribit in landmark US$2.9 billion crypto derivatives deal

Coinbase has announced its acquisition of Deribit, a leading crypto derivatives exchange, for $2.9 billion—the largest deal in the crypto industry to date. This strategic move positions Coinbase to expand its offerings in the crypto options market, catering to the growing demand for advanced trading products.

The acquisition includes US$700 million in cash and 11 million shares of Coinbase Class A common stock. Deribit, which processed US$1.2 trillion in trading volume last year, controls approximately 85 percent of the global crypto options market.

This deal is expected to enhance Coinbase’s presence in the international derivatives market and diversify its revenue streams.

Analysts view the acquisition as a significant step for Coinbase to compete with other major exchanges like Binance and Kraken in the derivatives space. The transaction is subject to regulatory approvals and is anticipated to close later this year. Until then, Deribit will continue its operations as usual.

Celsius founder sentenced to 12 years for crypto fraud

Alex Mashinsky, founder and former CEO of Celsius Network, has been sentenced to 12 years in federal prison for defrauding customers and manipulating the price of the company’s CEL token.

Between 2018 and 2022, Mashinsky misled investors about the safety of their funds, using customer deposits to inflate CEL’s value and personally profiting over US$48 million. Celsius, which once managed over US$25 billion in assets, collapsed in 2022 amid a broader crypto market downturn, leaving thousands of users unable to access their funds.

Securities Disclosure: I, Giann Liguid, hold no direct investment interest in any company mentioned in this article.

Securities Disclosure: I, Meagen Seatter, hold no direct investment interest in any company mentioned in this article.

This post appeared first on investingnews.com

There’s more than one way to invest in copper. In addition to buying shares of copper stocks, investors can gain exposure through copper exchange-traded funds (ETFs) or copper exchange-traded notes (ETNs).

For the uninitiated, ETFs are securities that trade like stocks on an exchange, but track an index, commodity, bonds or a basket of assets like an index fund. In the case of base metal copper, there are various options — an ETF can track specific groups of copper-focused companies, as well as copper futures contracts or even physical copper.

ETNs also track an underlying asset and trade like stocks on an exchange, but they differ from ETFs in some ways. Specifically, ETNs are more like bonds — they are unsecured debt notes issued by an institution, and can be held to maturity or bought and sold at will. The main disadvantage to be aware of is that investors risk total default if an ETN’s underwriter goes bankrupt.

The copper outlook is strong as demand rises and concerns about supply increase as the energy transition gains traction. This has caused many investors to wonder how to take advantage of the potential in the copper market.

1. Global X Copper Miners ETF (ARCA:COPX)

Assets under management: US$2.09 billion

The Global X Copper Miners ETF tracks the Solactive Global Copper Miners Index, which covers copper exploration companies, developers and producers. The fund has an expense ratio of 0.65 percent.

The fund currently has 39 holdings, with the top three companies being First Quantum Minerals (TSX:FM,OTC Pink:FQVLF), Freeport-McMoRan (NYSE:FCX) and Lundin Mining (TSX:LUN,OTC Pink:LUNMF).

2. United States Copper Index Fund (ARCA:CPER)

Assets under management: US$162.94 million

The United States Copper Index Fund aims to give investors exposure to a portfolio of copper futures without using a commodity futures account. It has an expense ratio of 1.04 percent.

The fund tracks the performance of the SummerHaven Copper Index Total Return (INDEXNYSEGIS:SCITR), which is calculated based on certain copper futures contracts selected on a monthly basis.

3. Sprott Physical Copper Trust (TSX:COP.U,OTCQX:SPHCF)

Assets under management: US$96.59 million

A relatively new ETF, the Sprott Physical Copper Trust was established in July 2024 and is one of the first funds to be based around physical copper. The fund has an expense ratio of 2.03 percent.

As of the start of May 2025, the fund held 10,157 metric tons of copper worth US$96.59 million.

4. iShares Copper and Metals Mining ETF (NASDAQ:ICOP)

Assets under management: US$50.63 million

The iShares Copper and Metals Mining ETF tracks the STOXX Global Copper and Metals Mining Index, which is composed of public companies primarily engaged in copper and metal mining. It has an expense ratio of 0.47 percent.

The fund represents a global portfolio of 41 copper companies. Its top three holdings are Grupo Mexico (OTC Pink:GMBXF,BMV:GMEXICOB), BHP (NYSE:BHP,ASX:BHP,LSE:BHP) and Freeport McMoRan.

5. Sprott Copper Miners ETF (NASDAQ:COPP)

Assets under management: US$23.65 million

Sprott Asset Management bills its Sprott Copper Miners ETF as ‘the only pure-play ETF focused on large-, mid- and small-cap copper mining companies that are providing a critical mineral necessary for the clean energy transition.’

It came to market in March 2024, and has an expense ratio of 0.65 percent.

The fund is made up of a portfolio of 49 companies and has a market cap of US$279 billion; it is rebalanced twice a year in June and December. The fund’s top three holdings are Freeport-McMoRan, Teck Resources (TSX:TECK.A,TECK.B,NYSE:TECK) and Ivanhoe Mines (TSX:IVN,OTCQX:IVPAF).

6. Sprott Junior Copper Miners ETF (NASDAQ:COPJ)

Assets under management: US$12.6 million

Launched in February 2023, the Sprott Junior Copper Miners is a pure-play ETF that, as its name suggests, is focused on small-cap copper miners. It has an expense ratio of 0.76 percent.

The fund consists of 40 companies, and its top three holdings are Northern Dynasty Minerals (TSX:NDM,NYSEAMERICAN:NAK), Solaris Resources (TSX:SLS,NYSEAMERICAN:SLSR) and Atalaya Mining (LSE:ATYM).

Like Sprott’s other copper fund on this list, COPJ is rebalanced twice a year in June and December.

7. iPath Series B Bloomberg Copper Subindex Total Return ETN (OTC Pink:JJCTF)

Assets under management: US$6.9 million

The iPath Series B Bloomberg Copper Subindex Total Return ETN provides exposure to the Bloomberg Copper Subindex Total Return. According to Barclays (LSE:BARC), the note ‘reflects the returns that are potentially available through an unleveraged investment in the futures contracts on copper.’ It is tied to the high-grade copper futures contract available on the Comex and carries an expense ratio of 0.75 percent.

Unlike an ETF, an ETN does not own the underlying asset. Instead, an ETN functions in the same way as an uninsured bond. Investopedia states that investors take their profits when they sell the note or it reaches maturity.

Securities Disclosure: I, Dean Belder, hold shares of Northern Dynasty Minerals.

This post appeared first on investingnews.com

  • Reviews 2025 exploration strategy across Freegold Mountain and Andalusite Peak
  • Advances acquisition strategy targeting high-grade silver assets
  • Engages Independent Trading Group to improve trading liquidity

triumph gold Corp. (TSXV: TIG) (OTC Pink: TIGCF) (FSE: 8N61) is pleased to provide an operational update as it enters 2025 with a refined exploration focus, strategic growth objectives, and a commitment to responsible development. The Company also announced it has engaged a market maker and granted incentive stock options.

Leadership and Direction

triumph gold continues under the leadership of John Anderson, Chairman and Interim Chief Executive Officer. With over 25 years of experience in the capital markets and resource sectors, Anderson has guided the Company since its early days as Northern Freegold.

‘We’ve taken meaningful steps to streamline operations and position the Company for disciplined growth,’ said Anderson. ‘With strong core assets, a focused strategy, and improving market conditions for gold and copper, Triumph prepares to enter the second quarter of 2025 ready to pursue opportunities that create long-term value’.

Key Assets and Positioning

Freegold Mountain Project

Located in Yukon, the flagship Freegold Mountain Project hosts over 2 million gold equivalent ounces across three mineralized zones, as defined in a 2020 NI 43-101 resource estimate. These deposits provide exposure to high-grade gold, copper, molybdenum, and tungsten at a time of increasing demand for critical minerals.

Andalusite Peak Property

Triumph’s Andalusite Peak copper-gold project is located in British Columbia’s Golden Horseshoe region, in proximity to major porphyry systems such as Saddle North and Red Chris. The Company plans to advance exploration in 2025 through geochemical surveys and mapping.

Favourable Jurisdictions
All assets are situated in well-established, mining-friendly regions of Yukon and British Columbia, offering stable permitting frameworks and access to infrastructure.

2025 Growth Strategy

triumph gold’s 2025 strategy centers on project advancement, portfolio expansion, and disciplined exploration:

  • Strategic Acquisitions
    The Company is evaluating potential acquisitions of high-quality silver projects to complement and diversify its current asset base.

  • Advancing Andalusite Peak
    Located in British Columbia’s Golden Horseshoe near Newmont’s Saddle North and Red Chris projects, the Andalusite Peak property will focus on geochemical surveys and detailed geological mapping in 2025.

  • Expanding Freegold Mountain Exploration
    Triumph will review historical datasets and define new exploration targets outside current resource zones to support potential discoveries.

Commitment to Responsible Development

triumph gold is committed to responsible exploration and development. The Company maintains active engagement with First Nations and local communities, recognizes the traditional territories on which its projects are located, and prioritizes environmental stewardship and cultural respect in all exploration activities.

Triumph Engages Independent Trading Group (ITG) as Market Maker

triumph gold announces that subject to regulatory approval, it has engaged the services of Independent Trading Group (‘ITG’) to provide market-making services in accordance with TSX Venture Exchange TSXV, CSE, and Cboe Canada policies. ITG will trade shares of the Company on the CSE/ Cboe Canada/ TSXV and all other trading venues to maintain a reasonable market and improve the liquidity of the Company’s common shares.

Under the agreement, ITG will receive compensation of CAD$6,500 per month, payable monthly in advance. The agreement is for an initial term of one month and will renew for additional one-month terms unless terminated. The agreement may be terminated by either party with 30 days’ notice. No performance factors are contained in the agreement, and ITG will not receive shares or options as compensation. ITG and the Company are unrelated and unaffiliated entities. At the time of the agreement, neither ITG nor its principals have an interest, directly or indirectly, in the securities of the Company.

triumph gold Issues Stock Options

The Company has granted 4,750,000 incentive stock options to directors, officers, employees, and consultants. The options are exercisable at $0.27 per share for a period of five years, with immediate vesting.

The options were granted pursuant to triumph gold’s rolling stock option plan, which has been approved by shareholders and the TSX Venture Exchange. This issuance is intended to retain and motivate key contributors and align long-term interests with those of shareholders.

Looking Ahead

triumph gold is entering 2025 with momentum, a clear strategy, and a commitment to shareholder value. The Company thanks its shareholders for their continued support and looks forward to sharing further updates in the months ahead. For more information or investor inquiries, please email John Anderson, Chairman & Interim CEO, at janderson@triumphgoldcorp.com.

About triumph gold Corp.

triumph gold is a Canadian-based, growth-oriented exploration and development company with a district-scale land package in the mining-friendly Yukon. Led by an experienced management and technical team, The Company is focused on actively advancing its flagship Freegold Mountain Project using multidiscipline exploration and evaluation techniques.

The road-accessible Freegold Mountain Project, located in the Dawson Range Au-Cu Belt, is host to three NI 43-101 Mineral Deposits (Nucleus, Revenue, and Tinta Hill). The Project is 200 square kilometres and covers an extensive section of the Big Creek Fault Zone, a structure directly related to epithermal gold and silver mineralization and gold-rich porphyry copper mineralization.

The Company owns 100% of the Big Creek and Tad/Toro gold-silver-copper properties situated along the strike of the Freegold Mountain Project within the Dawson Range.

The Company also owns 100% of the Andalusite Peak copper-gold property, 36 km southeast of Dease Lake within the Stikine Range in British Columbia.

triumph gold acknowledges the traditional territories of the Little Salmon Carmacks First Nation and Selkirk First Nation, on which the Company’s Yukon mineral exploration projects are located. triumph gold has a longstanding, ongoing engagement with these First Nations through communication, environmental stewardship, and local employment.

For more information, please visit triumphgoldcorp.com.

For further information about triumph gold, please contact:

John Anderson, Executive Chairman
triumph gold Corp.
(604) 218-7400
janderson@triumphgoldcorp.com

Neither the TSX Venture Exchange nor its Regulation Services Provider (as that term is defined in policies of the TSX Venture Exchange) accepts responsibility for the adequacy or accuracy of this release.

This news release contains forward-looking information, which involves known and unknown risks, uncertainties and other factors that may cause actual events to differ materially from current expectations. Important factors – including the availability of funds, the results of financing efforts, the completion of due diligence and the results of exploration activities – that could cause actual results to differ materially from the Company’s expectations are disclosed in the Company’s documents filed from time to time on SEDAR (see www.sedarplus.com). Readers are cautioned not to place undue reliance on these forward-looking statements, which speak only as of the date of this press release. The company disclaims any intention or obligation, except to the extent required by law, to update or revise any forward-looking statements, whether as a result of new information, future events or otherwise

To view the source version of this press release, please visit https://www.newsfilecorp.com/release/251572

News Provided by Newsfile via QuoteMedia

This post appeared first on investingnews.com

Exchange-traded funds (ETFs) are one of the fastest-growing investment vehicles, and as uranium’s role in the energy transition grows, investors are becoming increasingly interested in uranium ETFs and related products.

After years of dormancy, the uranium spot price zoomed past the US$100 per pound level in early 2024 on supply risks and a strong outlook for long-term demand. Although it’s since pulled back, bulls believe it still has room to run.

Supporting factors include the lack of new uranium mines, Russia’s dominance in conversion and enrichment, rising demand for low-carbon energy sources and the continued development and deployment of small modular reactors.

There is also increasing demand for uranium from China and India as both of these countries grapple with air pollution in the face of growing electricity demand. China is working to expand its nuclear power capacity, and although it ranks among the top 10 uranium-producing countries, it relies heavily on uranium imports.

Compounded, these factors are creating a mounting supply deficit.

“This year, uranium mines will only supply 75 percent of demand, so 25 percent of demand is uncovered,” Amir Adnani, CEO and president of Uranium Energy (NYSEAMERICAN:UEC), said at a January 2025 event.

Although the fundamentals are promising, the U3O8 spot price has faced pressure in 2025, with prices below US$80 since the start of the year. As supply tightens, incentivizing new projects to come online is becoming imperative.

“Next year, uranium demand is going up because there are 65 reactors under construction, and we haven’t even started talking about small and advanced modular reactors,” Adnani said. “Small and advanced modular reactors are an additional source of demand that, maybe not next year, but within the next three to four years, can become a reality.”

As mentioned, that backdrop is helping uranium ETFs and related investment products gain steam. Today there are five uranium ETFs available, as well as four investment vehicles backed by physical uranium — and perhaps more to come.

Read on to learn about the uranium ETFs and related vehicles on offer. All data was current as of May 5, 2025.

Uranium ETFs tracking uranium stocks

1. Global X Uranium ETF (ARCA:URA)

Total asset value: US$2.7 billion

The Global X Uranium ETF tracks a basket of uranium miners, as well as nuclear component producers.

The fund has an expense ratio of 0.69 percent and a yearly return of negative 17.23 percent, a decline that coincides with the recent pullback in the uranium price.

Uranium companies account for a significant portion of its portfolio, and nearly half of those companies are Canadian. The ETF’s top two uranium company holdings are major uranium producer Cameco (TSX:CCO,NYSE:CCJ) at a weight of 22.31 percent and NexGen Energy (TSX:NXE) at 5.64 percent. Interestingly, one of its top three holdings is the Sprott Physical Uranium Trust (TSX:U.U) at a weight of 8.52 percent.

2. Sprott Uranium Miners ETF (ARCA:URNM)

Total asset value: US$1.32 billion

The Sprott Uranium Miners ETF includes both uranium producers and explorers for broader exposure. The fund has an expense ratio of 0.75 percent and a yearly return of negative 34.69 percent.

Uranium stocks with market caps under US$2 billion account for 48.7 percent of the ETF’s holdings. Its top three holdings are Cameco at 15.28 percent, the Sprott Physical Uranium Trust at 13.21 percent and Kazatomprom (LSE:59OT,OTC Pink:NATKY) at 12.99 percent.

3. VanEck Vectors Uranium + Nuclear Energy ETF (ARCA:NLR)

Total asset value: US$1.02 billion

The VanEck Vectors Uranium + Nuclear Energy ETF launched in 2007 and tracks a market-cap-weighted index of stocks in the uranium and nuclear energy industries. Its expense ratio is 0.61 percent and its yearly return is negative 0.12 percent.

This uranium ETF’s top three holdings are Constellation Energy Group (NASDAQ:CEG) at a weight of 8.49 percent, Public Service Enterprise Group (NYSE:PEG) at 7.38 percent and Endesa (OTC Pink:ELEZF,SSE:ELE) at 6.95 percent.

4. Sprott Junior Uranium Miners ETF (NASDAQ:URNJ)

Total asset value: US$232.29 million

The Sprott Junior Uranium Miners ETF launched in February 2023, making it one of the newest additions to the uranium ETF universe. The ETF has an expense ratio of 0.8 percent and a yearly return of negative 15.51 percent.

It tracks the NASDAQ Sprott Junior Uranium Miners Index (INDEXNASDAQ:NSURNJ), which follows small-cap uranium companies. The fund’s 33 holdings are all uranium mining, development or exploration companies. Its top three holdings are Paladin Energy (ASX:PDN,OTCQX:PALAF) at 12.46 percent, Uranium Energy (NYSEAMERICAN:UEC) at 10.32 percent and NexGen Energy at 10.25 percent.

5. Horizons Global Uranium Index ETF (TSX:HURA)

Total asset value: US$55.08 million

The Horizons Global Uranium Index ETF was Canada’s first pure-play uranium ETF and provides exposure to uranium industry growth. It has an expense ratio of 1.06 percent and a yearly return of negative 25.2 percent.

Created in 2019, the fund’s top holdings are Cameco with a weight of 20.68 percent, Kazatomprom at a weight of 17.12 percent and the Sprott Physical Uranium Trust at 15.25 percent.

Physical uranium investment vehicles

1. Sprott Physical Uranium Trust (TSX:U.U)

Total asset value: US$4.09 billion

Of all the uranium-focused funds, this one has created the most buzz. Launched in July 2021, the Sprott Physical Uranium Trust quickly made its mark on the sector, stoking investor interest and prices for the commodity.

The fund holds 66.22 million pounds of U3O8, has an expense ratio of 0.64 percent and has a yearly return of negative 34.57 percent.

2. Yellow Cake (LSE:YCA,OTCQB:YLLXF)

Total asset value: US$983.66 million

Founded in 2018, Yellow Cake is a uranium company that provides investment exposure to the uranium spot price through its physical holdings of uranium and uranium-related commercial activities.

Yellow Cake’s current holdings total 21.68 million pounds of U3O8. Its access to material volumes of uranium at prevailing market prices comes via its long-term partnership with Kazatomprom. Through this partnership, it has the option to purchase up to US$100 million of uranium annually through 2027.

3. Zuri-Invest Uranium AMC

Total asset value: US$1.65 billion

Launched in April 2023, Zuri-Invest’s product is directly linked to physical uranium, and is the first actively managed certificate (AMC) in the sector. According to Zuri-Invest, “an AMC is a security that can be managed on a discretionary basis enabling the active management of a chosen investment strategy.”

Qualified non-US institutional and professional investors can take part in this physical uranium AMC (Swiss ISIN code CH1214916533) through their bank. The custodian of the product is Cameco, which holds the physical uranium in a secure storage facility in Canada.

4. xU3O8

Total asset value: US$5.93 million

One of the newest ways to gain exposure to physical uranium is through the token xU3O8.

Using the power of the Tezos blockchain and real-world asset tokenization, the xU3O8 token from uranium.io gives investors the ability to directly own and trade physical uranium. Launched in 2024, xU3O8’s 38,464.62 kilograms of U3O8 are stored at a secure Cameco facility, with Archax acting as trustee.

Securities Disclosure: I, Georgia Williams, hold no direct investment interest in any company mentioned in this article.

This post appeared first on investingnews.com

Legendary investor Warren Buffett is stepping down as CEO of Berkshire Hathaway (NYSE:BRK.A,NYSE:BRK.B) after six decades at the helm — but he’s still not yet ready to retire.

In a media release on Monday (May 5), Berkshire said that its board of directors unanimously has voted to appoint Greg Abel, vice chairman, non-insurance operations, as president and CEO come January 2026.

Buffett will remain the chairman of the board of directors.

Buffett has held the position of CEO at Berkshire since 1970, with Abel confirmed as his successor in 2021.

What is Buffett’s strategy?

Buffett took control of Berkshire in 1965, back when the company was a struggling textile manufacturer.

In a 2010 letter to shareholders, he recounted his experience in those early days:

‘Berkshire was then only intextiles, where it had in the previous decade lost significant money. The dumbest thing I could have done was topursue ‘opportunities’ to improve and expand the existing textile operation – so for years that’s exactly what Idid. And then, in a final burst of brilliance, I went out and bought another textile company. Aaaaaaargh!Eventually I came to my senses, heading first into insurance and then into other industries.’

Many people have tried to explain Buffett’s success in recent years. One recent Financial Times article titled “How Buffet Did It” notes that his strategy is “more than great stock picks and insurance premiums.”

An older paper called ‘Buffett’s Alpha’ suggests that his exposure to low-risk, cheap and high-quality stocks is key.

“(He) has boosted his returns by using leverage, and that he has stuck to a good strategy for a very long time period, surviving rough periods where others might have been forced into a fire sale or a career shift,” states the paper, which was written by Andrea Frazzini, David Kabiller and Lasse Heje Pedersen.

‘We estimate that Buffett applies a leverage of about 1.7-to-1, boosting both his risk and excess return in that proportion. Thus, his many accomplishments include having the conviction, wherewithal, and skill to operate with leverage and significant risk over a number of decades,’ the authors also note.

Who is Buffett’s successor?

Abel has been with Berkshire since 2000, when Berkshire bought MidAmerican, an energy company he had been running. He joined the board as vice chairman, non-insurance operations, in 2018.

MidAmerican was renamed Berkshire Hathaway Energy (BHE), with Abel serving as its chief executive officer from 2008 to 2018. He remains the company’s chair as of writing. At both MidAmerican and Berkshire, Abel was mentored by David Sokol, who seemed a likely successor to Warren Buffett until he resigned from Berkshire in 2011.

Abel was named vice chairman in 2018 along with Ajit Jain. In a 2014 letter to shareholders, Buffett’s longtime right-hand man, Charlie Munger, who passed away in 2023, wrote about the two as potential successors.

‘Ajit Jain and Greg Abel are proven performers who would probably be under-described as ‘world-class.’ ‘World-leading’ would be the description I would choose,’ said Munger.

‘In some important ways, each is a better business executive than Buffett.’

Buffett has also spoken highly of Abel, saying in 2023, ‘Greg understands capital allocation as well as I do. That’s lucky for us. He will make those decisions, I think, very much in the same framework as I would make them. We have laid out that framework now for 30 years.’

Berkshire’s path forward under Abel

Buffett’s words indicate that he sees Berkshire and Abel following the framework he has laid out.

Of course, there may be some evolution. Morningstar analyst Gregg Warren notes that the ‘groundwork for a successful transition’ at Berkshire has been in place for decades.

He also notes that Buffett and Munger were skilled at acquiring businesses that were a good cultural fit.

“We expect this to continue, believing that Berkshire’s culture of management autonomy and entrepreneurship has become institutionalized,’ Warren explains in a recent article.

‘ However, the new managers will probably work with a slightly different opportunity set, and we believe they will evolve Berkshire from what has historically been a reinvestment machine into one that is more focused on returning capital to shareholders, which is what we would expect of a company of this size with limited investment opportunities.”

Warren also comments that Berkshire currently doesn’t pay a dividend. This principle is because of Buffett’s belief that retained earnings should yield greater value than cash payouts.

Warren said this may change after Abel takes over, underlining that issuing a dividend could help Berkshire retain shareholders who may consider selling once Buffett is no longer at the helm.

Berkshire’s recent activities include diversification of its portfolio via strategic acquisitions and investments.

In January 2025, Forest River Bus & Van, a Berkshire subsidiary, announced its acquisition of L.A. West Coaches to enhance its product portfolio in the luxury transportation market.

“This partnership represents a shared commitment to excellence and innovation,” said Douglas Wright, group general nanager of Forest River Bus & Van. “L.A. West Coaches’ proven expertise and dedication to quality align with our values, and we look forward to collaborating to expand our product range.”

BHE is also currently exploring the production of lithium carbonate and other minerals from its geothermal power plants in California’s Imperial Valley, aligning with the company’s interest in renewable energy and sustainability.

BHE Renewables publicized a joint venture with Occidental Petroleum (NYSE:OXY) in June 2024, saying that this will be useful for the demonstration and deployment of TerraLithium’s direct lithium extraction.

Occidental is the owner of TerraLithium, a company that provides a technology platform for extracting lithium from geothermal and other brines to produce ultra-pure battery-grade lithium hydroxide and lithium carbonate.

Once the demonstration is successful, BHE Renewables plans to build, own and operate commercial lithium production facilities in California’s Imperial Valley. The joint venture also plans to license the technology and develop commercial lithium production facilities outside the Imperial Valley.

Securities Disclosure: I, Gabrielle de la Cruz, hold no direct investment interest in any company mentioned in this article.

This post appeared first on investingnews.com

Ukraine said Friday it had exposed a network of Hungarian spies trying to obtain defense secrets in a border region of Ukraine – the first time it said such an operation has been discovered.

The Security Services of Ukraine (SBU) said it had detained two Hungarian special services agents, whom it claims were reporting to a handler in Hungarian military intelligence and were looking for ground and air defense vulnerabilities in the southwestern Zakarpattia region, which borders Hungary.

“Comprehensive measures are currently underway to bring all members of the Hungarian intelligence network to justice,” said the statement.

Hungary responded to the arrests by expelling two of the staff at the Ukrainian embassy in Budapest.

Hungarian Foreign Minister Peter Szijjarto said on his Facebook page that two spies who had been working “under diplomatic cover” at the embassy were ordered to leave.

Ukraine and Hungary are at odds over the conflict between Ukraine and Russia and Ukrainian accession to the European Union. Hungary has also criticized European sanctions against Moscow.

The Hungarian government has also frequently complained that the ethnic Hungarian minority in Zakarpattia is discriminated against.

“The past three years have shown that the war in Ukraine is being fought not only on the battlefield, but also in the information space. Anti-Hungarian propaganda is often used without any factual basis,” Szijjarto said in a post on X in response to the arrests.

Speaking to reporters, Szijjarto said: “If we receive any details or official information, then we will be able to deal with this. Until then, I must classify this as propaganda that must be handled with caution.”

“We will not tolerate smear campaigns against Hungary and the Hungarian people,” he said, before alleging that “anti-Hungarian propaganda has intensified,” since the start of the war.

“We haven’t let Hungary be dragged into this war — and we won’t. That’s exactly why we keep being targeted,” Szijjarto said.

Ukraine’s SBU said the Hungarian spies were tasked with gathering information about the military security and studying the views of residents and “behavior scenarios” if Hungarian troops entered Zakarpattia.

The SBU alleged that one man from Berehove in Zakarpattia was recruited in 2021 and “activated” last September. It accused him of collecting information on the location of Ukrainian defense systems, including its S-300 anti-aircraft missile system in the region.

It also alleged he had attempted to recruit two other men as he tried to establish a “network of informants.”

The second person detained, a woman who left her unit in Ukraine’s Security and Defense Forces this year, had been tasked with informing the Hungarian special services about the defense systems of her unit and informing on the presence of aircraft and helicopters in the Zakarpattia region, the SBU claimed.

The Zakarpattia region stayed part of Ukraine after the breakup of the Soviet Union. The region was once part of the former Kingdom of Hungary and later Czechoslovakia.

According to a census in 2001, just over 150,000 ethnic Hungarians lived in the region, but the number is widely thought to have declined since then. Last year, representatives of the Hungarian-speaking community criticized a draft Ukrainian law that would have restricted the use of Hungarian in schools by allowing it to be used only in classroom activities and not outside classroom settings.

The two countries had disagreements over Hungary’s 2011 decision to relax its naturalization procedures and allow anyone who can speak Hungarian and has Hungarian ancestry to gain citizenship – even if they have never stepped a foot in the country. Tens of thousands of Ukrainians were granted Hungarian passports since then, despite Ukraine not allowing dual citizenship.

Hungarian Prime Minister Viktor Orban has opposed Ukraine’s accession to the EU in part because of claims that ethnic Hungarians in western Ukraine face discrimination.

Orban has remained on good terms with Moscow throughout the conflict and has opposed the growing raft of EU sanctions against Russia as well as EU aid packages for Ukraine.

On Wednesday, Orban said EU President Ursula von der Leyen “wants to pour further billions into Ukraine, pull Europe further into a losing war, and rush a bankrupt state into the EU.”

“Hungary won’t go along with this,” he said.

This post appeared first on cnn.com