Archive

April 2025

Browsing

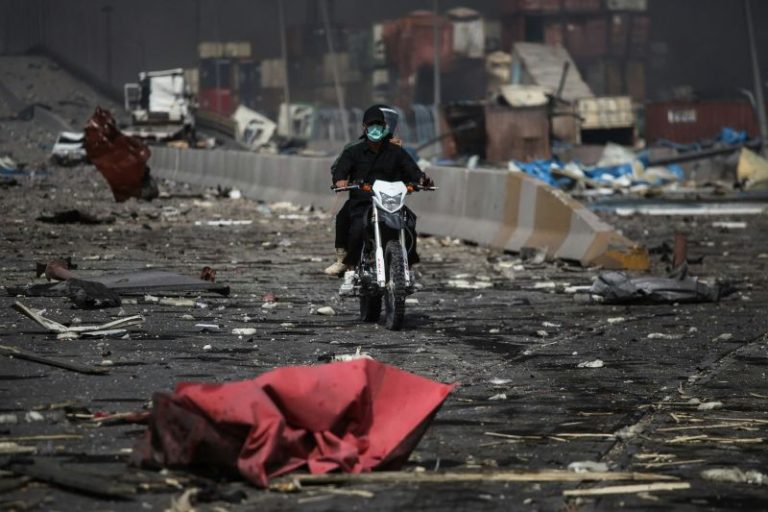
Five people have been killed and more than 700 injured in a huge explosion at the port of Bandar Abbas in southwestern Iran, according to official Iranian media.

The head of the Iranian emergency services said four people had died in the blast. A spokesperson for the emergency services earlier said 516 had been injured.

A video distributed by the Mehr news agency showed surveillance footage of the moment of the explosion, which appears to have occurred in a warehouse at the port. Other footage showed helicopters dropping water at the site of the fire ignited by the explosion.

Debris was spread over a wide area and many buildings at the port complex were badly damaged, according to state media. Windows within a radius of several kilometers were shattered, they said.

Some reports said people were trapped in the wreckage of a building that was reduced to rubble.

The region’s governor, Mohammad Ashouri Taziani, said injured people were being transferred to Bandar Abbas medical centers and the fire had been contained. The port has been closed and maritime operations suspended, according to state media.

Iranian President Masoud Pezeshkian has ordered an investigation into the causes of the incident. He wrote on X that the interior minister had been sent to the region to “examine the dimensions of the accident.”

State broadcaster IRIB said the explosion took place in the chemical and sulfur area of the port.

A government spokeswoman, Fatemeh Mohajerani, said it would take some time to establish the cause of the explosion – “but so far what has been determined is that containers were stored in a corner of the port that likely contained chemicals which exploded. But until the fire is extinguished, it’s hard to ascertain the cause.”

Shahid Rajaee is a large facility for container shipments, covering 2,400 hectares (around 5,900 acres). It handles 70 million tons of cargo annually, including oil and general shipping. It has nearly 500,000 square meters (5.4 million square feet) of warehouses and 35 shipping berths.

This post appeared first on cnn.com

The funeral of Pope Francis gave Catholics across the globe the chance to bid farewell to a beloved pontiff – and for world leaders to rub shoulders at a fraught time for international diplomacy.

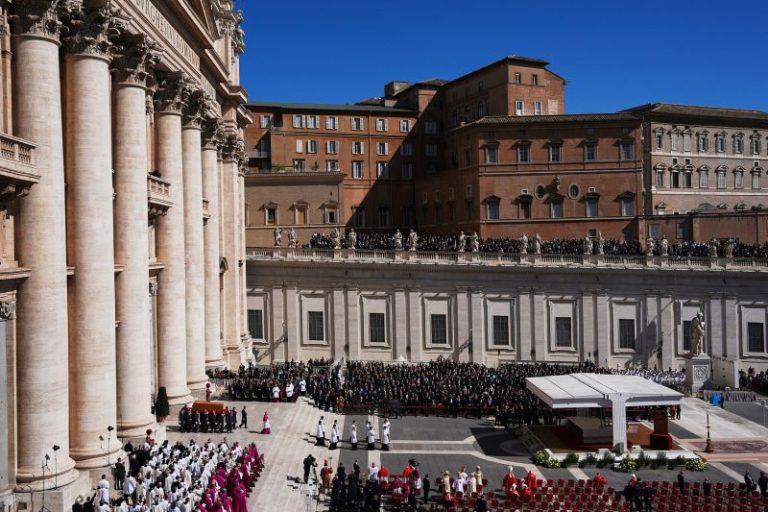
More than 250,000 people packed into St. Peter’s Square for Saturday’s service, the Vatican said, with members of the public there to mourn along with 55 heads of state.

The day’s most extraordinary meeting came just minutes before the service began. Presidents Donald Trump and Volodymyr Zelensky held what American and Ukrainian officials described as a “productive” discussion in St. Peter’s Basilica, as Francis’ coffin was about to be brought into the square.

So, what was said, who met who, and where did everyone sit?

What was the seating plan?

St. Peter’s Square was split into quarters. Dignitaries, cardinals and bishops were at the front, nearest the basilica, while clergy and the general public were a little further back. The coffin was placed in front of the central altar.

Behind the seated sections, thousands more had packed into the square, standing for more than two hours in the Italian heat.

In the dignitaries’ section, politicians sat in alphabetical order in French, the traditional language of diplomacy.

This meant that Trump – president of “États-Unis d’Amerique” – sat between the presidents of Finland and Estonia, two nations that share borders with Russia, and which will be especially wary of a reduced US military footprint in Europe.

Finland’s President, Alexander Stubb, played a round of golf with Trump in March during an unofficial trip to Florida. Trump said Stubb was a “very good player.” The Finnish presidency said the pair discussed European security, including Ukraine.

During Saturday’s “Sign of Peace,” a rite where members of the congregation shake hands with their neighbors and say “peace be with you,” Trump was seen shaking hands with several world leaders, including French President Emmanuel Macron.

The only dignitaries not sat in alphabetical order were those from Italy – the host nation – and Argentina – Francis’ birthplace. Italian Prime Minister Giorgia Meloni and Argentinian President Javier Milei were sat near the front, with a cluster of other officials.

What happened at the Trump-Zelensky meeting?

In what was their first meeting since the explosive Oval Office meeting in February, Trump and Zelensky huddled in close discussion without aides in the ornate surroundings of St. Peter’s Basilica, shortly before the service began.

Both the White House and Ukrainian presidency said the talk lasted around 15 minutes, describing it as positive. Zelensky said the meeting was “symbolic,” with the “potential to become historic, if we achieve joint results.” The crowd in the square broke into applause when Zelensky stepped into the square.

“We discussed a lot one on one. Hoping for results on everything we covered. Protecting lives of our people. Full and unconditional ceasefire. Reliable and lasting peace that will prevent another war from breaking out,” Zelensky wrote on X.

The US president and First Lady Melania Trump left Rome swiftly after the service, meaning the two leaders did not hold further discussions. Zelensky later met with Macron and British Prime Minister Keir Starmer. The four leaders were pictured together in the basilica, after Trump and Zelensky’s one-to-one.

Who else was there?

Britain’s Prince William was among a string of royals in Saturday’s crowd. William, next in line to the British throne, sat next to Olaf Scholz, the outgoing chancellor of Germany. Spain’s King Felipe and Queen Letizia, as well as Queen Mary of Denmark, were also in attendance.

Polish President Andrzej Duda and Hungarian Prime Minister Viktor Orban were among several other European leaders in attendance. The South American leaders there included Brazil’s President Luiz Inácio Lula da Silva – who had a close relationship with Francis – and Ecuador’s recently re-elected president Daniel Noboa.

The heads of several supranational institutions were also there, including Tedros Adhanom Ghebreyesus – head of the World Health Organization, from which Trump withdrew the US in January – and UN Secretary-General Antonio Guterres.

Julian Assange also made what was a rare public appearance since his release from Britain’s Belmarsh prison last year. The Wikileaks founder was seen with his wife, Stella, and their two children, at the Vatican.

This post appeared first on cnn.com

Russian authorities say they have detained a man described as a “Ukrainian special services agent” in connection with a car explosion that killed Russian General Yaroslav Moskalik on Friday.

The suspect allegedly purchased the car that exploded in Balashikha, less than 20 miles east of Moscow, according to TASS citing Russia’s Federal Security Service. The suspect’s nationality is unclear; according to the FSB, he has a residence permit in Ukraine.

The FSB also accused him of planting an explosive device in the car, but said that it was detonated from Ukraine. Video published by TASS on Saturday appeared to show charred electronics and parts of the car. Russia’s Investigative Committee had previously said the blast was caused by an improvised explosive device packed with shrapnel.

Photos released by Russian authorities appear to show the suspect driving a dark green Volkswagen with license plates that match those purportedly found at the site of the blast.

TASS video also showed the man being put into a van, and included footage of him apparently in custody describing his alleged recruitment by Ukraine’s special services. It’s unclear if he was under duress during the confession.

Moskalik was killed on the same day US special envoy Steve Witkoff met with Russian President Vladimir Putin at the Kremlin to discuss efforts to end Russia’s war on Ukraine.

After the three-hour meeting, US President Donald Trump initially voiced optimism that both sides were “very close to a deal.”

But the next day, Trump questioned whether Putin wants a peace deal shortly after meeting with Ukrainian President Volodymyr Zelensky at the Vatican for Pope Francis’ funeral.

In a Truth Social post sent as he returned from Rome after the meeting, Trump raised the prospect of applying new sanctions on Russia after its assault on Kyiv last week.

“There was no reason for Putin to be shooting missiles into civilian areas, cities and towns, over the last few days,” Trump wrote. “It makes me think that maybe he doesn’t want to stop the war, he’s just tapping me along, and has to be dealt with differently, through ‘Banking’ or ‘Secondary Sanctions?’ Too many people are dying!!!”

This is a developing story and will be updated.

This post appeared first on cnn.com
Pope Francis had a great sense of humor. When I met him once at the back of the papal plane, I cracked a joke with him that was a little bit close to the line. Luckily, he roared with laughter and told me “Sei cattivo!” (“You’re naughty!”). Every day, he used to say, he prayed the words of St. Thomas More: “Lord, give me a sense of humor.”

Francis took what he did seriously. But he never took himself too seriously.

One thing that struck me about him was his intuition and pastoral instincts. Whatever the situation, he always seemed to find the right words to say. When I met him with my family one time, my youngest child was crying.

“Whenever they see a man in white, they think I’m a doctor and about to give them some medicine!” he joked.

His ability to read people was also vital in his leadership. When he met bishops, he would get them into a circle and ask which one wanted to start speaking. It allowed him to understand the dynamics of a group, which helped him make appointments and decisions in the future.

Francis liked to make himself accessible. He would say his door was always open – but that same door also had a sign on it that read “no whining.”

There was never a dull moment covering his pontificate. As pope, he gave more media interviews than anyone else, but he never had a spokesperson or media advisers. Predicting his next move was notoriously difficult, and when it came to appointing new cardinals, no one knew in advance who he’d be choosing or when. New cardinals would talk about their phones blowing up in the middle of a Mass as people tried to contact them to tell them the news.

Francis wasn’t naïve, however. He was a politically savvy pope, very decisive and often stubborn. He wanted to stay true to himself and not become scripted. My enduring memory is of a very human pope who was full of surprises. He leaves big shoes to fill.

This post appeared first on cnn.com

Fatalities have been confirmed after a car plowed into a crowd at a street festival celebrating Filipino heritage in Vancouver on Saturday night, according to officials in the Canadian city.

“A number of people have been killed and multiple others are injured after a driver drove into a crowd at a street festival,” the Vancouver Police Department wrote in a statement on X.

The driver of the vehicle is in custody, according to police.

Prime Minister Mark Carney mourned the dead and wounded, calling the ramming “horrific” in a statement on X.

“I offer my deepest condolences to the loved ones of those killed and injured, to the Filipino Canadian community, and to everyone in Vancouver. We are all mourning with you,” he wrote.

Vancouver’s mayor also offered condolences.

“I am shocked and deeply saddened by the horrific incident at today’s Lapu Lapu Day event,” Ken Sim wrote on X.

“Our thoughts are with all those affected and with Vancouver’s Filipino community during this incredibly difficult time.”

Sim said he would provide more information on the incident.

This is a developing story and will be updated.

This post appeared first on cnn.com

If you’re like most options traders, you’ve probably stared at your watchlist or portfolio and wondered, “What’s the best trade I can make right now?” Well, we’ve got great news: your trading workflow just got a serious upgrade.

Thanks to the latest integration between StockCharts.com and OptionsPlay, the OptionsPlay Strategy Center now lets you scan real-time options strategies directly from your ChartLists. That’s right—your long-term holdings, sector watchlists, or technical scan results can now feed straight into a personalized options engine that does the heavy lifting for you.

Let’s break it all down—how it works, what strategies it supports, and how to squeeze the most juice out of this awesome new feature.

Step-by-Step: How It Works

1. Launch the OptionsPlay Strategy Center. Head over to your Dashboard in StockCharts.com and click the OptionsPlay Strategy Center button (you’ll find it at the top). This kicks off your deep dive into the Trade Ideas and ChartLists.

2. Pick your ChartList from the Dropdown menu. Choose from any of your saved lists. These could be:

  • Long-term holdings
  • Growth stock watchlist
  • Sector-specific lists
  • Any list where you want to compare options strategies to find the highest performing options strategies, personalized to your trading and risk preferences.

3. View Real-Time Strategy Rankings

Here’s where the magic happens. For each symbol in your list, OptionsPlay will:

  • Evaluate the optimal strategy based on market conditions
  • Rank it by Strategy Score, Risk/Reward, and Probability
  • Give you the full risk analytics: Max Risk & Reward, Probability of Profit, IV Rank, Earnings Dates, etc.

4. Customize Based on Your Preferences

Want only spreads? Prefer shorter expirations? Looking for bullish setups?

You can customize strategies using the built-in settings:

  • Choose your preferred strategy types. Covered calls, credit spreads, debit spreads, etc.
  • Adjust your risk tolerance or Days to Expiration (DTE) window.
  • Filter for bullish, bearish, or neutral trade setups.

5. Dive Deeper or Trade It

Launch the OptionsPlay Strategy Center in SharpCharts or ACP to explore the trade structure, or export your results to enter them with your broker.

Real-World Use Cases

Income Strategy on Holdings

Got a list of stocks you already own? Use the Strategy Explorer to scan for Covered Calls or Short Puts that offer the best combo of yield and downside protection.

Directional Setups on ChartLists

Have a ChartList generated based on your custom-built scan? Run your technical trade ideas through the Strategy Explorer and identify the highest-yielding Bullish Debit Spreads or Bearish Credit Spreads, aligned with your technical views.

The OptionsPlay Strategy Center is no longer just a tool for trade ideas—it’s a fully personalized trading engine. Whether you’re a portfolio-focused investor or an active options trader, this feature cuts hours off your research and puts hours of professional-grade options research in front of you.

Ready to Try It?

Launch the OptionsPlay Strategy Center and pick a ChartList to explore personalized strategies on your stocks, in real time.


Subscribe to the OptionsPlay Add-on for StockCharts for just $40/month and find enough income to cover your first few months on your first covered call!

This week will be the biggest week of earnings season and yes, all eyes will be on the heavy-hitters: META, AMZN, MSFT, and AAPL. These names dominate headlines, and their charts are practically seared into our brains.

But let’s look at some solid companies that might fly under the radar but deserve some attention.

First Up, Coca-Cola Co. (KO)

KO shares have been a safe haven and steady gainer during these uncertain times. Shares are up over 15.5% year-to-date as the consumer staple giant and Warren Buffett’s favorite stock outperforms the overall market.

However, coming into this week’s earnings release, momentum seems to be fizzling out. Shares of rival PepsiCo. (PEP) missed the mark and traded lower. The biggest component of the Consumer Staples Select Sector SPDR ETF (XLP), Procter & Gamble (PG), also fell after mixed results.

Last week, investors shifted back into Technology and Consumer Discretionary and away from Consumer Staples. Shares of KO also fell as a result and now sit at an interesting level heading into its earnings release.

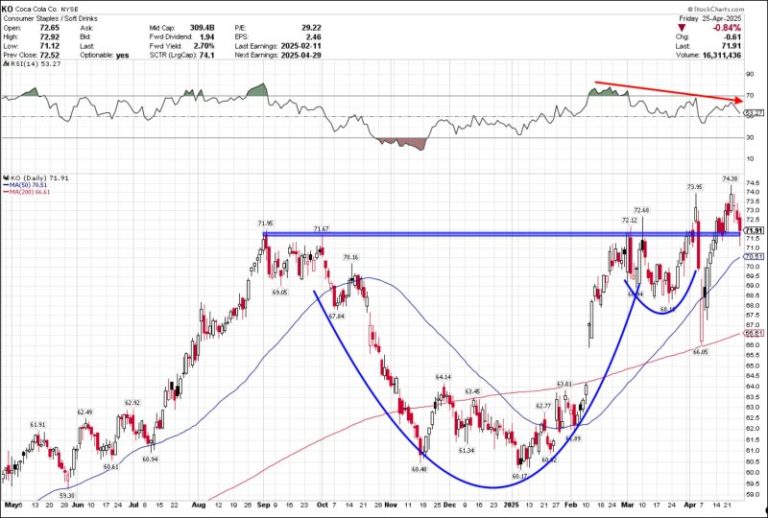
FIGURE 1. DAILY CHART OF COCA COLA CO. Note the saucer pattern.

Technically, shares had formed one of my favorite reversal patterns over the last year—a saucer bottom. This saucer bottom did not resolve to the upside and got faked out on “Liberation Day”. That drop quickly reversed as shares again tried to break out from this pattern. Yet again, they are struggling to do so as momentum wanes.

The safe trade in KO has lost momentum on each rally, as seen in the lower highs of its relative strength index (RSI). This bearish divergence is cause for concern as price hits a crossroads into earnings.

The upside move may be limited for now, and shares could retreat to between $67 and $70. After last quarter’s report, shares broke out to the upside and climbed higher. It will be critical for the bulls to see shares stay above $71/$72 for a continuation of this recent run.

For now, the stock has fallen flat, and if the rotation back into tech continues, it may take time for KO to take another leg higher.

Next Up, Visa, Inc. (V)

V has been another outperformer relative to its sector and the overall market. Shares are up 6.1% year-to-date and 22% over the last 52 weeks.

What should investors watch for in Tuesday’s report? Consumer spending, especially in travel and dining—areas where Visa often sees the most activity. Have investors changed their tune given tariff uncertainty and potential price swings, or have they rushed to spend due to any potential increases?

FIGURE 2. DAILY CHART OF VISA, INC. The stock is holding key support level but is making lower highs.

Technically, we are looking at a two-year daily chart to show the longer-term uptrend. That helps us put the recent weakness in perspective. Shares have declined 17% from their peak, but the sell-off was mostly orderly and took shares back to their rising 200-day moving average.

Shares were able to hold that key support area but have consistently made lower highs since its February peak. It also sits at its 50-day moving average, which is also starting to turn over. So things are at a near-term crossroads.

Clearly, earnings will be the catalyst to help shares make their next move. The moving average convergence/divergence (MACD) has triggered a buy signal and reached its lowest levels in two years. That is a positive development and could lead to an upswing that breaks the recent trend and gets shares back on a path to new highs.

Last, But Not Least, Intercontinental Exchange Group (ICE)

ICE, the parent company of the NYSE, has benefited from market volatility and expanding trading volumes. Shares are up 6.1% year-to-date and over 21% over the last 52-weeks.

FIGURE 3. DAILY CHART OF ICE. The stock price may face some headwinds, but a break above $167 will be positive for the stock.

Shares had been on a tear before mid-March. Then the market turned and took ICE shares with it. However, the sell-off took shares to critical technical levels where they held. The stock closed under its 200-day moving average for six days on its last trip below the level. Ironically, it did the same thing in early January and then rallied.

Now that the big test of the long-term uptrend was successful again, we head into earnings hoping it can build from this level. A risk/reward set-up is quite favorable if we use a level just under the 200-day for a stop loss.

The upside has minor challenges as well, but the path of least resistance looks higher. Any gap or rally over $167 should lead to a momentum surge higher. Its MACD just triggered a buy signal, and a solid earnings report should take shares to their old highs.

Final Thoughts

While the big tech names will dominate the headlines this week, it’s often the lesser-watched stocks that quietly outperform. KO, Visa, and ICE all have compelling stories and interesting technical setups going into earnings. If you’re looking for opportunities beyond the big tech stocks, these could be worth a closer look.

In this video, Grayson highlights the crucial 5,500 level on the S&P 500 using our “Tactical Timing” chart. He then demonstrates two of the easiest methods for identifying the strongest stocks within key indexes like the S&P 500, NASDAQ 100 and Dow Industrials. He’ll show you how to find leading stocks that are moving higher using the New Highs feature of the Market Summary dashboard. From there, Grayson explores the Index Members page, and explains how to sort by SCTR rankings to quickly pinpoint the strongest stocks within any major index.

This video originally premiered on April 25, 2024. Click on the above image to watch on our dedicated Grayson Roze page on StockCharts TV.

You can view previously recorded videos from Grayson at this link.

The S&P 500 index managed to log one of its strongest weeks in 2025. Short-term breadth conditions have improved, and the crucial 5500 level has now been broken to the upside. Are we in the later stages of a countertrend rally, or just in the early innings of a broader recovery for stocks?

Let’s review three key charts together and evaluate the evidence.

Trendline Break Suggests Further Short-Term Strength

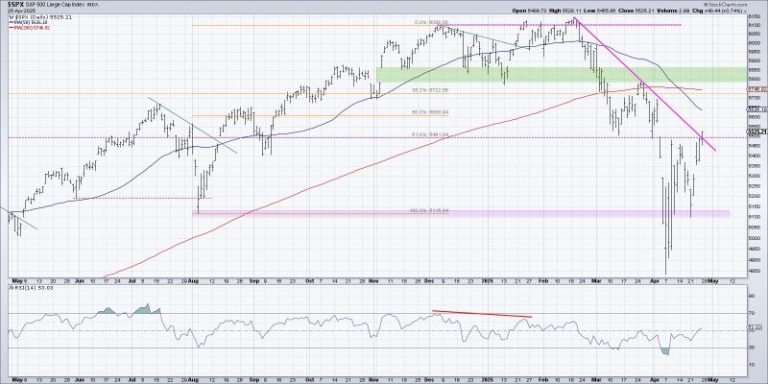
My daily chart of the S&P 500 has featured a thick pink trendline since March, when a lower peak around 5800 provided a perfect opportunity to define the downtrend phase. With the quick reversal off the early April low around 4850, the SPX has finally broken back above this trendline.

To be clear, after a breakout of this magnitude, I’m always looking for confirmation from the following day. Will additional buyers come in to push this chart even further to the upside? Assuming that’s the case, then I’m immediately drawn to a confluence of resistance in the 5750-5850 range. The 200-day moving average is currently sitting right around the late March peak, and both of those levels line up well with a price gap back in November 2024.

If the S&P 500 can finally break above that resistance range, I would expect much further upside for risk assets.

Breadth Conditions Confirm Short-Term Market Strength

One of the biggest improvements I’ve seen coming out of the early April low is the upgrade in short-term breadth conditions. The McClellan Oscillator has broken back above the zero level, most days this week saw more advancers than decliners, and the Bullish Percent Index has definitely improved.

In the bottom panel, we can see that the S&P 500 Bullish Percent Index has risen from a low just above 10% at the April low to finish this week at 64%. That confirms that over half of the S&P 500 members generated a point & figure buy signal in the month of April!

But the middle panel shows the real challenge here, in that long-term measures of breadth are still clearly in the bearish range. Just 35% of the S&P 500 stocks are above their 200-day moving average, similar to the S&P 500 and Nasdaq 100. It’s only if this indicator can push above the 50% level that the S&P 500 could stand a real chance of sustainable gains above 5750.

The Stoplight Technique Lays Out a Clear Playbook

I love to overlay a “stoplight” visualization on a chart like this, helping me clarify how I’ll think about risk depending on where the S&P 500 sits at any given point.

I would argue that a confirmed break above resistance at 5500 brings the S&P 500 chart into the “neutral” bucket. In this way, we’re respecting the fact that a rally from 4850 to 5500 is a fairly impressive feat, but also acknowledging that the SPX remains below its most important long-term trend barometer, the 200-day moving average.

If we see further gains in the weeks to come, the SPX may indeed push into the bullish range, which for me would mean a push above 5750-5800. In that scenario, the S&P 500 would be clear of its 200-day moving average, and I would feel much more comfortable adding risk to the portfolio. Until and unless we see that upside follow-through, though, I’ll remain comfortably defensive.

RR#6,

Dave

P.S. Ready to upgrade your investment process? Check out my free behavioral investing course!


David Keller, CMT

President and Chief Strategist

Sierra Alpha Research LLC


Disclaimer: This blog is for educational purposes only and should not be construed as financial advice. The ideas and strategies should never be used without first assessing your own personal and financial situation, or without consulting a financial professional.

The author does not have a position in mentioned securities at the time of publication. Any opinions expressed herein are solely those of the author and do not in any way represent the views or opinions of any other person or entity.

After weeks of uncertainty, the stock market finally gave us something to smile about. The major indexes just wrapped up four straight days of gains, and optimism is starting to creep back in. Could this be the shift we’ve been waiting for?

Let’s break it down.

The big concerns this week were all about tariffs and the potential removal of Fed Chairman Jerome Powell. But markets breathed a sigh of relief when it looked like tensions might ease between the two largest global economies. Plus, Powell staying put at the Fed helped calm some nerves.

In short, the fear factor took a breather, and the bulls took charge.

What Are the Charts Telling Us?

The S&P 500 ($SPX) crossed above the key 5500 level. This isn’t just any number; it’s a major line in the sand. It represents the March low and, if you go further back on the daily chart below, it has been a support and resistance level for previous price action. The purple horizontal line marks the 5,500 level.

FIGURE 1. SIGNS OF A TURNAROUND? The S&P 500 closed above the key 5,500 level, a major breakthrough. Breadth indicators are suggesting expanding bullish participation. Chart source: StockCharts.com. For educational purposes.

Even better, market breadth is improving.

  • The Bullish Percent Index (BPI) for the S&P 500 is at 65% — a solidly bullish reading.
  • The Advance-Decline Line is trending higher.
  • The percentage of S&P 500 stocks trading above their 200-day moving average is beginning to display increasing bullish participation.

We are also seeing strength across the board:

  • BPI readings for the Nasdaq 100, S&P 100, S&P 500, and Dow Industrials are all above 50%.
  • 10 of the 11 S&P 500 sectors have BPIs above 50%, with Consumer Staples being the only one with a BPI below 50. This is surprising since it was one of the only sectors above 50% not long ago.

Sector Watch: Who’s Leading?

If you’re looking for clues about the market’s next big move, watch sector rotation. Right now, leadership is coming from:

  • Technology
  • Consumer Discretionary
  • Communication Services

These are your classic “risk-on” sectors—if they’re leading, that’s typically a bullish sign.

What About Bonds, Gold, and the Dollar?

Some of the big-picture trends are starting to stabilize, too:

  • Bond yields are dipping, which is helping bond prices recover.
  • Gold pulled back after hitting new highs.
  • The U.S. dollar is showing signs of strength again.
  • And the $VIX—Wall Street’s fear gauge—is finally back below 30.

All small signs, but they add up.

Indicator of the Week: The Zweig Breadth Thrust

One indicator all technical analysts should take note of is the Zweig Breadth Thrust indicator.  It’s a rare signal that flashes when market breadth shifts quickly from bearish to bullish.

The indicator is the 10-day exponential moving average (EMA) of net NYSE advances. The NYSE Breadth Thrust signal fires when the indicator moves from below 0.40 to above 0.615 in 10 days.

The weekly chart below shows that this is the third time the Zweig Breadth Thrust signal was fired in the last five years. The last two times this occurred were in 2023, when the NYSE recovered after dipping below its 40- and 150-week simple moving average (SMA). This time, the index bounced off its 150-week SMA.

FIGURE 2. ZWEIG BREADTH THRUST FIRES A REVERSAL SIGNAL. Previous signals have been followed by bullish moves in the NYSE. Will we see a similar scenario this time? Chart source: StockCharts.com. For educational purposes.The Zweig Breadth Thrust is a bullish reversal signal. Note that each time the signal was fired, the market moved higher. It doesn’t guarantee a bull run, but it’s a green flag.

What’s Coming Next Week?

If this weren’t a headline-driven market, I would be more confident about the possibility of the market moving higher. Next week is packed with potential market-moving headlines.

  • Big Tech earnings
  • Q1 GDP
  • PCE Inflation data (the Fed’s favorite inflation gauge)
  • ISM Manufacturing
  • Non-Farm Payrolls

At the Close

The underlying market conditions are improving and some key signals are flashing green. But, as noted, it’s still a headline-driven market, and that means all the more reason to stay alert. Focus on leading sectors, watch for confirmation in breadth, and keep your investment plan tight.


End-of-Week Wrap-Up

  • S&P 500 up 4.59% on the week, at 5525.21, Dow Jones Industrial Average up 2.48% on the week at 40,113.50; Nasdaq Composite up 6.73% on the week at 17,382.94.
  • $VIX down 16.22% on the week, closing at 24.84.
  • Best performing sector for the week: Technology
  • Worst performing sector for the week: Consumer Staples
  • Top 5 Large Cap SCTR stocks: Palantir Technologies, Inc. (PLTR); Rocket Lab USA, Inc. (RKLB); Robinhood Markets, Inc. (HOOD); Rubrik, Inc. (RBRK); MicroStrategy, Inc. (MSTR)

On the Radar Next Week

  • Earnings season continues with Meta (META), Microsoft (MSFT), Apple (AAPL), Amazon (AMZN), and others reporting
  • March JOLTs Job Openings
  • Q1 GDP Growth Rate
  • March PCE
  • April ISM Manufacturing
  • April Non-Farm Payrolls


Disclaimer: This blog is for educational purposes only and should not be construed as financial advice. The ideas and strategies should never be used without first assessing your personal and financial situation, or without consulting a financial professional.