Archive

March 2025

Browsing

European leaders will once again try to grasp control of negotiations over the war in Ukraine on Thursday, in an increasingly frantic tug-of-war against the US and Russia that could be nearing a climax.

Heads of the 27 European Union (EU) nations are meeting at a special summit in Brussels to discuss a path forward in the conflict. But some fear that the involvement of ambivalent countries could derail efforts to put together a peace plan which might satisfy both Kyiv and Washington.

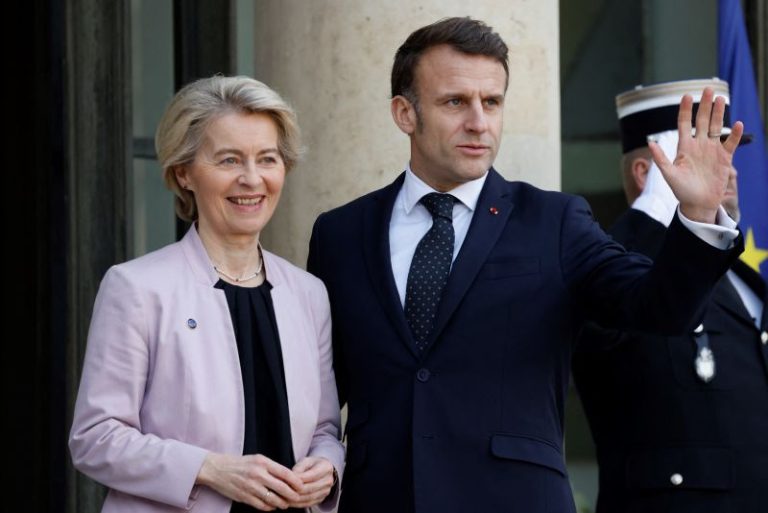
Europe is “entering a new era,” French President Emmanuel Macron admitted in a televised address on Wednesday night, describing an increased weariness over the shift in tone of US President Donald Trump toward Moscow.

“The United States, our ally, has changed its position on this war, is less supportive of Ukraine and is casting doubt on what will happen next,” Macron warned.

Thursday’s meeting is the latest in a string of sessions aimed at finding a ceasefire deal with Ukraine’s support before the US and Russia force one on Kyiv. A Sunday summit in London saw some progress: UK Prime Minister Keir Starmer said a small group of European nations would work with Ukraine’s President Voldoymyr Zelensky on a ceasefire proposal, then present it to the US – a workaround that might avert another meltdown in relations between Trump and Zelensky.

Zelensky said on Telegram Wednesday that Kyiv and Europe “are preparing a plan for the first steps to bring about a just and sustainable peace. We are working on it quickly. It will be ready soon.”

But Thursday’s EU-wide meeting has a key difference: It involves every nation in the bloc, not just the countries who opted to attend Starmer’s summit. And some countries are neither willing nor interested in supporting Ukraine’s fight for survival.

Hungarian Prime Minister Viktor Orban has repeatedly resisted calls to support Kyiv militarily. Unlike most of his European counterparts, he supported Trump following the president’s argument with Zelensky, writing on X: “Strong men make peace, weak men make war.”

Sharing the burden

Reaching an agreement on that will prove difficult. Without singling any countries out, the diplomat highlighted how the countries that aren’t paying their “fair share” when it comes to Ukraine are also usually failing to spend over 2% of their gross domestic product on defence.

Some serious progress is nonetheless expected. European Commission President Ursula von der Leyen announced a plan to rearm Europe in the build-up to the summit, and said the bloc could mobilize funds up to 800 billion euros ($862 billion) to achieve it. “We are in an era of rearmament,” she said in a statement Wednesday.

“The question is no longer whether Europe’s security is threatened in a very real way,” she added. “Or whether Europe should shoulder more of the responsibility for its own security. In truth, we have long known the answers to those questions.”

There are immediate discussions taking place too: including on what the peacekeeping force deployed to Ukraine to uphold a potential ceasefire might look like. First proposed just two weeks ago, the force has quickly morphed from an idea to an apparent condition of any deal.

But the official said Eastern European states that neighbor Russia were concerned that contributing to the force might leave their own borders vulnerable – a fear that Poland has been particularly open about since it was first raised.

“European NATO has about 5,000 kilometers (3,100 miles) of eastern border, so you don’t want to empty the eastern border,” the official said. “Most likely the boots on the ground, if there is to be such a component, will not come from countries like Finland or Poland who are frontline countries already and need to keep the boots on their own ground.”

The official said it was a “reasonable assumption” that most of the troops would come from Britain, France and Turkey.

The official said a timeline for confidence-building measures was under discussion, but said it might prove “challenging” for a limited ceasefire in Ukraine and prisoner swaps to begin by Easter. Agreeing and implementing a full-blown ceasefire across the whole front line in that timeframe would be “completely unrealistic,” they added.

Zelensky will attend Thursday’s meeting in Brussels. He has been welcomed warmly by European leaders at recent meetings in Paris and London, a dramatic contrast to his frosty reception at the White House. But on Thursday, there will be more ambivalent faces in the crowd.

This post appeared first on cnn.com

The US government will stop sharing air quality data gathered from its embassies and consulates, worrying local scientists and experts who say the effort was vital to monitor global air quality and improve public health.

In response to an inquiry from The Associated Press, the State Department said Wednesday that its air quality monitoring program would no longer transmit air pollution data from embassies and consulates to the Environmental Protection Agency’s AirNow app and other platforms, which allowed locals in various countries, along with scientists around the globe, to see and analyze air quality in cities around the world.

The stop in sharing data was “due to funding constraints that have caused the Department to turn off the underlying network” read the statement, which added that embassies and consulates were directed to keep their monitors running and the sharing of data could resume in the future if funding was restored.

The fiscal cut, first reported by the New York Times, is one of many under President Donald Trump, whose administration has been deprioritizing environmental and climate initiatives.

The US air quality monitors measured dangerous fine particulate matter, known as PM2.5, which can penetrate deep into the lungs and lead to respiratory diseases, heart conditions, and premature death. The World Health Organization estimates that air pollution kills around 7 million people each year.

News of the data sharing being cut prompted immediate reaction from scientists who said the data were reliable, allowed for air quality monitoring around the world and helped prompt governments to clean up the air.

‘A big blow’ to global air quality research

Bhargav Krishna, an air pollution expert at New Delhi-based Sustainable Futures Collaborative, called the loss of data “a big blow” to air quality research.

“They were part of a handful of sensors in many developing countries and served as a reference for understanding what air quality was like,” Krishna said. “They were also seen to be a well-calibrated and unbiased source of data to cross-check local data if there were concerns about quality.”

“It’s a real shame”, said Alejandro Piracoca Mayorga, a Bogota, Colombia-based freelance air quality consultant. US embassies and consulates in Lima, Peru, Sao Paulo and Bogota have had the public air monitoring. “It was a source of access to air quality information independent of local monitoring networks. They provided another source of information for comparison.”

Khalid Khan, an environmental expert and advocate based in Pakistan, agreed, saying the shutdown of air quality monitoring will “have significant consequences.”

Khan noted that the monitors in Peshawar, Pakistan, one of the most polluted cities in the world, “provided crucial real-time data” which helped policy makers, researchers and the public to take decisions on their health.

“Their removal means a critical gap in environmental monitoring, leaving residents without accurate information on hazardous air conditions,” Khan said. He said vulnerable people in Pakistan and around the world are particularly at risk as they are the least likely to have access to other reliable data.

In Africa, the program provided air quality data for over a dozen countries including Senegal, Nigeria, Chad and Madagascar. Some of those countries depend almost entirely on the US monitoring systems for their air quality data.

The WHO’s air quality database will also be affected by the closing of US program. Many poor countries don’t track air quality because stations are too expensive and complex to maintain, meaning they are entirely reliant on US embassy monitoring data.

Monitors strengthened local efforts

In some places, the US air quality monitors propelled nations to start their own air quality research and raised awareness, Krishna said.

In China, for example, data from the US Embassy in Beijing famously contradicted official government reports, showing worse pollution levels than authorities acknowledged. It led to China improving air quality.

Officials in Pakistan’s eastern Punjab province, which struggles with smog, said they were unfazed by the removal of the US monitors. Environment Secretary Raja Jahangir said Punjab authorities have their own and plan to purchase 30 more.

Shweta Narayan, a campaign lead at the Global Climate and Health Alliance, said the shutdown of monitors in India is a “huge setback” but also a “critical opportunity” for the Indian government to step up and fill the gaps.

“By strengthening its own air quality monitoring infrastructure, ensuring data transparency, and building public trust in air quality reporting, India can set a benchmark for accountability and environmental governance,” Narayan said.

This post appeared first on cnn.com

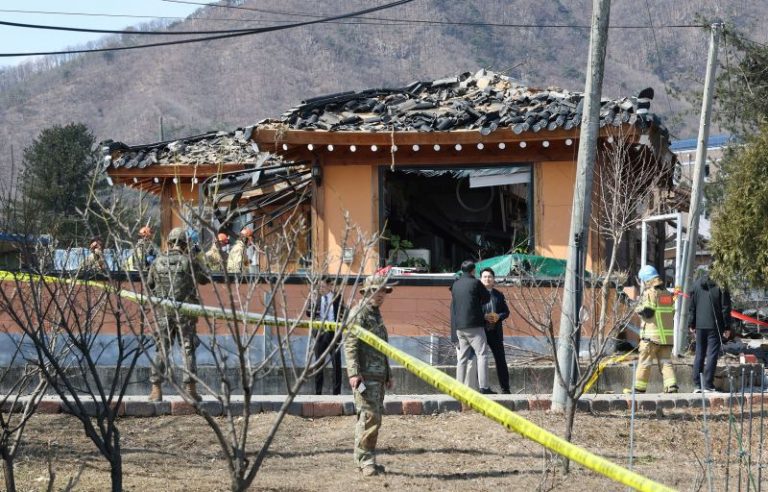
South Korean fighter jets accidentally bombed homes during a live-fire drill with US forces, injuring more than a dozen people, Seoul’s military said on Thursday.

Eight MK-82 general-purpose bombs were “abnormally dropped” from two KF-16 fighter jets and landed outside the designated firing range at approximately 10:07 a.m. local time, hitting civilian infrastructure in Pocheon city, northeast of the capital Seoul, according to the South Korean Air Force.

South Korea’s defense ministry said initial findings indicated the accident was caused by a pilot inputting incorrect bombing coordinates.

An image that local media outlets said captured the aftermath of the explosions showed thick smoke billowing into the air in a rural area.

The blasts destroyed two residential buildings, part of a church, and a truck.

“The scene of the incident is chaotic, resembling a battlefield,” Pocheon Mayor Baek Young-hyun said in a televised statement.

South Korea’s military said all live-fire training would be suspended from Thursday until a probe into the incident had concluded. An accident response team has been formed to investigate and the air force said it would provide compensation for damages.

The air force apologized that the “abnormal bomb release has caused civilian damage” and wished the injured a swift recovery.

The Freedom Shield drills were scheduled to run from March 10 to March 20 to strengthen the US-South Korean alliance’s combined defense posture, Seoul’s Joint Chiefs of Staff said earlier Thursday.

The annual drills often rile nuclear-armed North Korea, which views them as provocations.

North Korean leader Kim Jong Un has accused the United States and South Korea of increasing tensions with their joint drills and Pyongyang often responds with bellicose threats.

In 2023, as US strategic bombers took part in joint air drills with South Korean forces, North Korea carried out a ballistic missile test, according to the South Korean military.

This story has been updated with additional information.

This post appeared first on cnn.com

In this video, Dave analyzes market conditions, bearish divergences, and leadership rotation in recent weeks. He examines the S&P 500 daily chart, highlighting how this week’s selloff may confirm a bearish rotation and set downside price targets using moving averages and Fibonacci retracements. To validate a potential end to the bearish phase, he shares a key technical analysis chart. What’s your S&P 500 downside objective?

This video originally premiered on March 4, 2025. Watch on StockCharts’ dedicated David Keller page!

Previously recorded videos from Dave are available at this link.

With US tariffs on Canada, Mexico, and China having taken effect at midnight on Tuesday, US indexes extended their Monday losses, deepening concerns over the escalating trade war.

It was only a few months ago when analysts held relatively optimistic forecasts of emerging and developed market performance relative to the US. Since Trump’s re-election, Wall Street has grown more cautious due to renewed trade tensions, particularly with China, Canada, and Mexico. Nevertheless, given the sharp decline in US stocks, I thought it might be prudent to examine international markets to see how emerging and developed markets might be responding to the new Trump trade war.

Here’s a MarketCarpets view of the action early Tuesday morning:

FIGURE 1. MARKETCARPETS ONE-DAY VIEW OF INTERNATIONAL MARKETS. It’s a mixed bag with mostly negative responses.Image source: StockCharts.com. For educational purposes.

As expected, iShares MSCI Canada ETF (EWC) and iShares MSCI Mexico Capped ETF (EWW) are down while iShares MSCI China ETF (MCHI) remained resilient in the early part of the trading session.

For a broader yet short-term perspective, the five-day view shows a similar trend, but with deeper losses.

FIGURE 2. FIVE-DAY VIEW OF MARKETCARPETS INTERNATIONAL MARKETS. No clear leadership here with developed and emerging markets largely declining across the board.Image source: StockCharts.com. For educational purposes.

Developed and emerging markets are largely in the red with no clear leadership. What markets are bracing for are the tariff responses, which could significantly complicate and negatively impact global trade dynamics.

Developed vs. Emerging vs. US Markets

For those of you who might not be aware of it, the “developed” category excludes US markets. This may seem as strange as China’s inclusion in the “emerging” category where it is the second largest economy in the world. But there you have it. So, to get a clear picture of relative performance between the US markets, developed markets, and emerging markets, we’ll look at three ETFs representing each category and compare their performance using a one-year view on PerfCharts.

  • iShares MSCI EAFE ETF (EFA): developed markets
  • iShares MSCI Emerging Markets ETF (EEM): emerging markets
  • SPDR S&P 500 ETF (SPY): broader US stock market

FIGURE 3. PERFCHARTS COMPARING RELATIVE PERFORMANCE OF DEVELOPED MARKETS, EMERGING MARKETS, AND THE S&P 500. The S&P and emerging markets are declining, but developed markets are rising and holding steady.Chart source: StockCharts.com. For educational purposes.

To get an even clearer, if not more direct comparison, take a look at a weekly ratio chart comparing EFA with EEM. From here on out, we’ll be focusing solely on international markets (omitting the S&P 500).

FIGURE 4. CHART OF EFA:EEM WITH GUPPY MULTIPLE MOVING AVERAGES. Notice how the short- and longer-term market sentiment is in an uneasy equilibrium.Chart source: StockChartsACP.com. For educational purposes.

What’s valuable about plotting a Guppy Multiple Moving Average (GMMA) is that its two color-coded ribbons are proxies for short and long-term investors. Developed markets have been trending strongly against emerging markets since the summer of 2021. But now, with the two ribbons converging, it’s telling you that short- and long-term sentiment is hovering at an uneasy equilibrium. There’s still plenty of uncertainty, even with developed markets pulling ahead.

Despite the global trade environment, might EFA or EEM present any tradable opportunities from a technical perspective? Let’s shift over to a daily chart of EFA for a closer look.

FIGURE 5. DAILY CHART OF EFA. A wide trading range with a few indications of a potential breakout.Chart source: StockCharts.com. For educational purposes.

EFA is trading near the top of a wide trading range. If you were to look at a naked chart of EFA, the price action would seem a little chaotic. This is why I decided to plot the following indicators to contextualize the price action. As complex as it may look, the indicators make the price action simpler to understand.

Here are a few key points to consider:

  • EFA’s wide trading range is defined by the August low and September high.
  • The latest surge is accompanied by a rise in the StockCharts Technical Rank (SCTR) score, which has now surpassed 70 (a bullish threshold I use) signaling strong technical momentum across multiple indicators and timeframes.
  • The Accumulation/Distribution Line (ADL) is rising steadily and is above the current price, indicating that money flows are steadily pouring into the ETF (and by proxy, stocks included in this particular developed market index).
  • I am dividing EFA’s range using Quadrant Lines. Note how the 2nd and 3rd quadrants align with the areas of concentrated trading volume, as shown by the Volume-by-Price indicator. This high-volume range can act as either support or resistance. If EFA were to eventually break out of its current range, a favorable scenario would be to see it trade above the lower limits of the third quadrant; more preferably, bouncing off the second quadrant and eventually breaking above its September high.

If this looks semi-bullish, EEM looks a bit more stuck. Here’s a daily chart.

FIGURE 6. DAILY CHART OF EEM. Support and resistance levels are plotted in an otherwise messy trading range.Chart source: StockCharts.com. For educational purposes.

EEM has sharply declined after falling below the bullish SCTR threshold of 70. After failing to retest its September high, it has retraced back toward the middle of a range that extends as far back as May of last year. The most concentrated portion of that range, as shown by the Volume-by-Price, lies between $41.50 and $43.50. While the ADL signals positive buying pressure relative to the decline in price, it’s also flattening out, indicating that money flows may be steadily declining.

Despite the volatile price action, support and resistance levels remain well-defined (and the  Volume-by-Price indicator helped confirm these levels). EEM is likely to bounce between support ($41 and $42) and resistance ($43.50 and $45.50) unless macroeconomic catalysts trigger a breakout in either direction below or above the current range. For now, patience is key—waiting for EEM to establish a clearer direction, technically or fundamentally.

Action Steps

Here are a few things you can do:

  • Add EEM and EFA to your ChartLists.
  • Observe how their price response to key levels mentioned above aligns with global trade environment developments.
  • Monitor MarketCarpets (International ETFs) regularly to see if any patterns of consistency emerge over time.
  • If a market shows consistent bullish or bearish trends, zoom in on the specific countries to determine if they align with their developed or emerging market group or are moving independently.
  • Monitor the SCTR scores and analyze those charts further to see if they present investment opportunities.

At the Close

Given the heightened uncertainty surrounding global trade, developed markets have shown relative strength, while emerging markets remain in a fragile position. With tariff responses still unfolding, you should stay alert to price action while monitoring broader market sentiment for signs of directionality. For now, patience and observation remain key in navigating these volatile markets.


Disclaimer: This blog is for educational purposes only and should not be construed as financial advice. The ideas and strategies should never be used without first assessing your own personal and financial situation, or without consulting a financial professional.

More than anything else, rapid urbanization is driving demand for critical minerals like copper around the world.

Delivering the opening keynote address at this year’s Prospectors and Developers Association Conference (PDAC) in Toronto, Ontario, Canada, BHP (ASX:BHP,NYSE:BHP,LSE:BHP) CEO Mike Henry spoke to the opportunities and challenges posed by the growth of urban centers around the world.

His presentation discussed how the mining industry, including Canada’s, can respond to the growing demands on the resource sector and deliver the critical minerals that will be required over the next few decades.

The opportunity: Copper and critical mineral demand outpacing supply

Over the last 10 years, there has been a global population redistribution. For the first time, more of the world’s population lives in urban centers than in rural areas. Along with this shift has come greater densification, which has pushed electrical grids to their limits.

However, as Henry pointed out, this is just the beginning. By 2050, the global population will grow by 25 percent to 10 billion people, and the vast majority of them will live in urban centers.

“They are the engines of massive opportunity for our industry. More high rises, homes, roads and infrastructure, greater electrification, more phones, televisions, cars and air conditioning. More energy, more data centers to power AI and cloud computing,” he said.

This population boom means the world will need more of everything, from copper and steel to potash and other minerals.

As a company, BHP is a global powerhouse. Its portfolio of assets touches on a variety of minerals that will be critical in the coming decades; few, however, may be as important as copper. Henry suggests that demand for red metal will rise 70 percent over the next 15 years.

The massive surge in demand presents an enormous opportunity for the resource sector, especially for investors. Outlining the scale of capital required, Henry estimates that more than US$250 billion will be needed for mining and concentration to keep pace with demand growth, with additional funding needed for smelting and refining — and that’s just for copper.

When other minerals are added to the equation, the total could reach US$800 billion between now and 2040.

The first challenge: Finding significant critical mineral deposits in Canada

Although opportunities exist, they don’t come without challenges, and Henry suggests that the challenges exist both above and below ground.

“First, we’re going to have to find the resources… Those resources are big, large deposits that are becoming harder to find,’ he said. ‘They’re deeper, they’re more remote, they come with new technical challenges, and they’re often in riskier jurisdictions.’

This has led to BHP rethinking how it invests in exploration, seeing them not only fund and carry out exploration work itself, but partnering with other companies around the world.

Some of these partnerships have seen work being carried out in Canada with Henry suggesting considerable untapped resources in the country.

“Of course, Canada has extensive exploration history already, yet much of this has been at shallow depths in subaortic areas. So there remains potential to find deeper or underexplored parts of the country, and we’re engaged in that effort with a specific focus on copper,” he said.

The solution, he said, is to apply new technologies from other sectors, including 3D seismic sensors and muon tomography. However, this new technology generates huge amounts of data, which benefits from advances in artificial intelligence to help make sense of all the information being collected.

Henry says that BHP has taken a different approach to partnerships by borrowing from the tech sector.

“We’ve also borrowed the accelerator concept from big tech, and we are supporting innovative exploration technologies, methods, and ideas through our global accelerator program, BHP Explorer,” Henry said.

The implications are enormous for an industry that needs new ideas brought to the forefront in short timelines.

The second challenge: Government mining policies

However, the biggest challenge facing the resource sector comes not from within the industry but from outside it.

Henry suggested that the biggest changes can come from evolving government policy, and he thinks things are beginning to move in the right direction. Canada itself released a critical minerals strategy in 2021, and its latest update includes 34 minerals and metals.

“There has been a very welcome burst of renewed government interest in critical minerals in recent times, and the motivations do vary,” he said.

For some governments, this interest stems from a desire to use resources to unlock the economic opportunity associated with decarbonizing the global energy grid. Meanwhile, other governments are pursuing critical minerals needed to provide energy security, economic sovereignty and defense supply chain resilience.

Henry noted that some countries are taking steps to make themselves more competitive and are working to attract capital investment for projects through fiscal reform and tax credits. He also pointed out that some governments are streamlining the regulatory process, which he suggests will speed up development time and reduce risks.

Henry sees incredible benefits in Canada due to the strength of the mining sector, but he cautions that past successes aren’t indicative of future success. He believes Canada is in danger of missing out on the next great opportunities in the resource sector.

“Other countries have some mix of even better resource endowments in certain commodities, better tax and royalty regimes, more streamlined permitting processes, while still maintaining high standards and more productivity, enabling industrial relations framework,” Henry said.

Henry sees complacency and bureaucracy as the enemy of growth and economic security, and believes Canada needs to accelerate its efforts to match those being carried out elsewhere.

In comparison, he points to Chile, where he says they’ve accelerated permitting for multi-billion dollar greenfield projects to five to 10 years and even shorter for brownfield developments. In Canada, he said, those timelines stretch to 10 to 15 years.

“Global capital is going to flow to the best opportunities, risk return opportunities globally. So if a country isn’t constantly benchmarking and saying, what’s the combined effect of our industrial relations policies, our tax settings, our permitting process relative to the other countries that are chasing the same opportunity, we run the risk of falling behind,” Henry said.

What does this mean for investors?

Henry outlined a potential for staggering growth in the mining sector for critical minerals such as copper over the next 15 to 20 years. He suggested there is an opportunity for investors looking to get into the sector at all levels, from exploration to production.

He also noted that it is not without problems. When investors evaluate projects, especially early in development, they should recognize that a multitude of factors could determine their success or failure.

Henry touched on access to the resource, the depth of the deposit and its remoteness. He also noted that jurisdictions play a huge part in a project’s success, so investors should research a country’s permitting process and tax system, as well as why a country may look to fast-track projects and whether it affects a company’s risk analysis.

“Once capital mobilizes in one direction, sometimes it can be quite hard to mobilize back in the other,” Henry said.

Securities Disclosure: I, Dean Belder, hold no direct investment interest in any company mentioned in this article.

This post appeared first on investingnews.com

Fear is gripping the financial markets in 2025. CNN’s Fear and Greed Index, a widely followed gauge of investor sentiment, has plunged into the ‘Extreme Fear’ zone.

After dipping to 22 at the end of February, the index had fallen to 20 as of March 4, reflecting deep unease among traders and institutional investors alike.

This shift comes amid a mix of economic uncertainties and global geopolitical tensions that have left investors skittish. This includes the US Trump administration enacting tariffs on allies Canada and Mexico on March 4, as well as the administration pulling away from Ukraine and towards Russia.

While market sentiment indicators don’t dictate future price movements, they provide insight into the emotional state of the market — often a contrarian signal for savvy investors. When fear reaches extreme levels, it has historically marked moments of potential opportunity or further market turbulence.

But what does this drop into Extreme Fear really mean? How is the index calculated? And how have past instances of such extreme sentiment played out in the markets?

This article explores the significance of the CNN Fear and Greed Index, its historical context and what investors should watch for next.

What is CNN’s Fear and Greed Index?

CNN’s Fear and Greed Index is a tool designed to measure the prevailing emotions influencing the stock market by weighing seven key indicators.

The Fear and Greed Index operates on a scale from 0 to 100, with a score under 45 indicating fear, a score of 55 and above signifying greed, and one in between marked as neutral. Scores of under 25 and above 75 are labeled Extreme Fear and Extreme Greed, respectively.

How is CNN’s Fear and Greed Index calculated?

The index aggregates seven key indicators, each reflecting different aspects of market sentiment:

  1. Stock Price Strength – Tracks the number of stocks hitting 52-week highs versus those reaching 52-week lows.
  2. Stock Price Breadth – Examines trading volume in advancing versus declining stocks.
  3. Put and Call Options – Analyzes the ratio of bearish (put) options to bullish (call) options.
  4. Junk Bond Demand – Measures the yield spread between high-yield (junk) bonds and safer investment-grade bonds.
  5. Safe Haven Demand – Assesses the relative performance of stocks versus government bonds.

When these indicators collectively signal heightened caution, the Fear and Greed Index falls into the fear zone, with Extreme Fear indicating widespread pessimism in the markets.

Other instances of Extreme Fear

Understanding past instances of Extreme Fear can provide insights into current market conditions. The last two notable times the index hit Extreme Fear were August 5, 2024, and December 19, 2024.

1. August 5, 2024: Global sell-off and economic uncertainty

On August 5, 2024, markets saw a sharp decline following weak tech earnings and US employment data, accelerated by an unexpected interest rate hike by the Bank of Japan resulting in investors trying to unwind their yen carry trades. This caused a ripple effect across global markets:

  • Japan’s Nikkei index plummeted 12 percent in a single session.
  • The International Monetary Fund (IMF) warned that the volatility could be a precursor to prolonged instability.

2. December 19, 2024: Federal Reserve’s hawkish stance

Investor fears resurfaced in mid-December when the US Federal Reserve signaled that interest rates would likely remain elevated longer than expected. The announcement sent shockwaves through the markets:

  • The US dollar surged to a two-year high, weighing heavily on emerging markets.
  • Cryptocurrencies took a hit, with Bitcoin dropping over 15 percent in a week.

How do other fear-based indices compare?

While CNN’s Fear and Greed Index is a popular barometer of market sentiment, it isn’t the only fear-based indicator worth watching. Here’s how other major sentiment gauges compare:

Crypto Fear & Greed Index

The Crypto Fear & Greed Index tracks investor sentiment in the cryptocurrency market. Crypto markets are particularly sensitive to risk-off sentiment, making this index an important measure for digital asset investors.

The Crypto Fear & Greed Index has also dropped into Extreme Fear with a score of 15 on March 4. This decline coincided with continued geopolitical tensions, particularly US President Donald Trump’s announcement of new 25 percent tariffs on Canada and Mexico that day.

Doomsday Clock

Though not a financial index, the Doomsday Clock, updated annually by the Bulletin of Atomic Scientists, reflects global existential risks, including nuclear tensions, climate change and geopolitical instability.

As of January 28, 2025, the clock is at 89 seconds to midnight, signaling heightened global uncertainty, which can influence investor sentiment in risk assets like equities and cryptocurrencies.

What Extreme Fear means for investors

The plunge of CNN’s Fear and Greed Index into Extreme Fear territory signals widespread investor anxiety. But is this a warning of further declines, or a contrarian buy signal?

Historically, moments of extreme fear have often preceded strong market rebounds, as panicked selling creates opportunities for value investors. However, not all instances lead to immediate recoveries — some mark the beginning of prolonged downturns.

Key considerations for investors:

  • Economic data: Keep an eye on employment reports, inflation data and GDP growth figures.
  • Federal Reserve policy: Interest rate decisions will continue to be a key driver of market sentiment.
  • Corporate earnings: Weak earnings reports could exacerbate investor fears, while strong results may signal resilience.
  • Geopolitical developments: Trade tensions, global conflicts and macroeconomic policies can shift market sentiment quickly.

While fear-based indicators provide valuable insights, investors should use them alongside fundamental and technical analysis to make informed decisions.

Whether this moment marks a temporary panic or the start of a broader downturn remains to be seen, but one thing is clear: investors should be prepared for volatility in the weeks or months ahead.

Securities Disclosure: I, Giann Liguid, hold no direct investment interest in any company mentioned in this article.

This post appeared first on investingnews.com