Archive

March 11, 2025

Browsing

Sector Shake-Up: Defensive Moves and Tech’s Tumble

Last week’s market volatility stirred up the sector rankings, with 6 out of 11 sectors changing positions. While the top three remain steady, we see a clear rotation from cyclical to more defensive sectors. Let’s dive into the details and see what the charts tell us.

The weekly sector ranking has undergone some significant changes. Communication Services (XLC) is holding firm. Financials (XLF) is maintaining position. Consumer discretionary remains steady, but is showing weakness. Consumer Staples (XLP) is the new entrant to the top 5, while Utilities (XLU) Holds its ground at #5.

The big story here is the rise of defensive sectors. Health Care (XLV) made a notable jump from 10th to 6th place, while Technology (XLK) took a nosedive from 4th to 10th. This shift is characteristic of the broader shift from cyclical to defensive plays.

The New Sector Lineup

  1. (1) Communication Services – (XLC)
  2. (2) Financials – (XLF)
  3. (3) Consumer Discretionary – (XLY)
  4. (6) Consumer Staples – (XLP)*
  5. (5) Utilities – (XLU)
  6. (10) Healthcare – (XLV)*
  7. (9) Real-Estate – (XLRE)*
  8. (7) Industrials – (XLI)*
  9. (8) Energy – (XLE)*
  10. (4) Technology – (XLK)*
  11. (11) Materials – (XLB)

Weekly RRG: A Tale of Two Sides

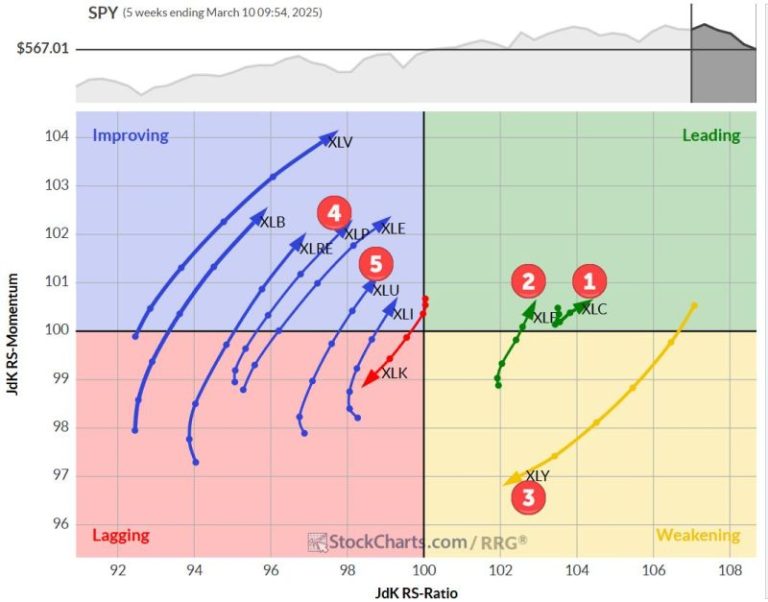
The weekly Relative Rotation Graph (RRG), printed above, paints an interesting picture. We see only three sectors on the right-hand side of the graph, with the rest clustered on the left. But their movements are telling:

  • XLC is in the leading quadrant, moving northeast — a positive sign.
  • XLF has turned back up into the leading quadrant, reinforcing its #2 spot.
  • XLY is in the weakening quadrant with a long tail, heading towards lagging — a potential red flag.

On the left side:

  • XLK’s rotation is clearly weak, pushing further into the lagging quadrant.
  • Meanwhile, XLP and XLU show strength, moving with positive RRG headings in the improving quadrant.

Daily RRG: Confirming the Weekly Story

When we look at the daily RRG, we get some additional context:

  • XLC has curled up in the weakening quadrant, supporting its positive weekly rotation.
  • XLF is confirming its positive move in the leading quadrant.
  • XLY is the outlier — its short tail in the lagging quadrant doesn’t bode well for maintaining its #3 position.
  • XLP shows the strongest RS ratio reading on the daily chart, complementing its positive weekly movement.
  • XLU has lost some relative momentum over the last day, but nothing too concerning at this point.

The Top Five Charts

Communication Services – XLC

XLC is playing around with its old resistance line, now expected to act as support. Monday’s price action shows a slight revival, but it’s too early to call. The relative strength remains robust, with a clear series of higher highs and higher lows on the raw RS line.

Financials – XLF

XLF has broken its rising support line and completed a toppish formation. We’re now eyeing the next support level, around $47.25. Despite this, XLF’s relative performance remains strong, with both RRG lines moving higher.

Consumer Discretionary – XLY

After completing a top formation, XLY is now testing support around 200. It appears to be moving back into its old rising channel — and if my rule holds true, we might see it test the lower boundary. This suggests significant downside risk for the sector.

Consumer Staples – XLP

XLP, the newcomer to the top 5, is pushing against overhead resistance in the $83.50-84 area. A break here could give the sector a significant boost. The improvement in relative strength is already evident, pulling both RRG lines higher.

Utilities – XLU

XLU remains in a sideways pattern, potentially settling into a narrower range between $75.50 and $80.50.

Its relative strength is also range-bound but still pulling both RRG lines up — enough to keep it in the top 5.

Portfolio Performance Update

The technology position was exited and swapped for the consumer staples position against Monday’s opening prices.

As of about 45 minutes after opening, the portfolio performance stands at -3.19% since inception, compared to the SPY benchmark at -3.39%. We’re about 20 basis points ahead — not making a big dent, but keeping pace with the S&P 500 for now.

Going forward, I’ll be including both the performance table and the list of open positions in these articles for better tracking.

Summary

The market’s rotation towards defensive sectors is becoming increasingly evident. Consumer discretionary looks vulnerable, while consumer staples and utilities show strength.

#StayAlert, –Julius


The market sell-off continued in earnest after a brief respite on Friday. Uncertainty of geopolitical tensions and tariff talk has spooked the market and given the weakness of mega-cap stocks, we are likely to see more downside before a snapback rally.

Carl was off today so Erin had the controls! She started off the trading room with a review of the DP Signal Tables to get a sense of market strength and weakness. She then analyzed indicator charts on the SPY and finished with a look at key areas of the market: Bitcoin, Dollar, Gold, Gold Miners, Yields, Bonds and Crude Oil.

After the market review Erin took a look at the Magnificent Seven daily and weekly charts. Not one of them were showing strength. Most had lost key support levels and were heading lower.

Erin then walked us through sector rotation. It is clear that the defensive sectors of the market are leading the way with the exception of Utilities which have been in a declining trend. Erin dove into the Energy sector, looking under the hood to determine if the current rally will continue.

She finished the trading room with a review of viewer symbol requests that included: PAYC, VLO and LLY among others.

Don’t forget that you can join us live in the trading room by registering once at this link: https://zoom.us/webinar/register/WN_D6iAp-C1S6SebVpQIYcC6g#/registration

We love doing the trading room, but we do have to make a living! Come try out any of our subscriptions for two weeks free with our trial coupon code: DPTRIAL2. You’ll find our subscriptions here: https://www.decisionpoint.com/products.html

01:21 DP Signal Tables

04:44 Market Analysis

18:05 Questions

21:47 Magnificent Seven

32:39 Sector Rotation

38:08 Symbol Requests


The DP Alert: Your First Stop to a Great Trade!

Before you trade any stock or ETF, you need to know the trend and condition of the market. The DP Alert gives you all you need to know with an executive summary of the market’s current trend and condition. It not only covers the market! We look at Bitcoin, Yields, Bonds, Gold, the Dollar, Gold Miners and Crude Oil! Only $50/month! Or, use our free trial to try it out for two weeks using coupon code: DPTRIAL2. Click HERE to subscribe NOW!


Learn more about DecisionPoint.com:


Watch the latest episode of the DecisionPointTrading Room on DP’s YouTube channel here!


Try us out for two weeks with a trial subscription!

Use coupon code: DPTRIAL2 Subscribe HERE!


Technical Analysis is a windsock, not a crystal ball. –Carl Swenlin


(c) Copyright 2025 DecisionPoint.com


Disclaimer: This blog is for educational purposes only and should not be construed as financial advice. The ideas and strategies should never be used without first assessing your own personal and financial situation, or without consulting a financial professional. Any opinions expressed herein are solely those of the author, and do not in any way represent the views or opinions of any other person or entity.

DecisionPoint is not a registered investment advisor. Investment and trading decisions are solely your responsibility. DecisionPoint newsletters, blogs or website materials should NOT be interpreted as a recommendation or solicitation to buy or sell any security or to take any specific action.


Helpful DecisionPoint Links:

Trend Models

Price Momentum Oscillator (PMO)

On Balance Volume

Swenlin Trading Oscillators (STO-B and STO-V)

ITBM and ITVM

SCTR Ranking

Bear Market Rules


“The trend is your friend, until the end when it bends.”

How often have you heard this adage? More importantly, how often do you follow it?

Chasing stocks, whether it’s one that was texted to you as the next high-flying AI stock, a popular meme stock, or the next hot IPO, can be tempting. If you’re lucky, the price moves in your favor, you get elated, and you throw one heck of a party. Alas, the story doesn’t always end this way. The stock market can catch you off guard. It gives you several opportunities, but also unexpectedly robs them from you. This is especially true during an overextended market.

Any negative news headlines make investors nervous, leading them to make irrational decisions. To avoid falling into the trap of buying and selling stocks at the wrong time, take the smart approach and set some basic rules to follow.

Rule 1: Determine the Market’s Long-term Trend

You want to trade in the direction of the long-term trend—buy when the trend is up and sell when it is down. Buying stocks when the overall trend is declining can be like catching a falling knife, while selling stocks when the trend is rising could mean missing sizable moves. To determine the overall direction of the stock market’s long-term trend, look at a chart of a benchmark index, such as the S&P 500 ($SPX), that covers at least one year.

We’ll examine the weekly chart of the S&P 500 (see below). Overall, the index has trended higher for the last five years, but there have been pullbacks, some longer and more severe than others (pink shaded areas). The index is going through a pullback now, although we won’t know the magnitude of it until it’s over.

FIGURE 1. WEEKLY CHART OF THE S&P 500. Overall, the trend in the benchmark has been bullish, although there have been periods of declines and pullbacks. The index is going through a decline.Chart source: StockCharts.com. For educational purposes.

From January 2022 to October 2022, the S&P 500 declined over 20%. Many Wall Street analysts expected the decline to continue, but the S&P 500 recovered, ending 2023 with a 26.3% gain and 2024 with a 23.31% gain. There were a few minor pullbacks along the way, some more pronounced than others (end of 2023 and July to August 2024).

Nobody knows what the market will do, but, when you see a pullback forming—and it looks like one is forming—don’t plan on opening long positions. If you’re not convinced the market is pulling back, view a daily chart of the S&P 500 to see if it aligns with the weekly chart’s trend. If both indicate a downtrend or the two don’t align, you need to dig deeper.

Rule 2: Is Market Breadth Expanding or Contracting?

Market breadth is an effective method to uncover the percentage of stocks participating in the uptrend. The Bullish Percent Index (BPI) is one of several breadth indicators available in StockCharts and is available for indexes, sectors, and industry groups.

The chart below displays the BPI for the S&P 500 in the upper panel ($BPSPX) against the daily chart of the S&P 500 in the lower panel. When the BPI is above 50%, it indicates the bulls have an edge. When it’s below 50%, the bears have an edge.

FIGURE 2. DAILY CHART OF S&P 500 BULLISH PERCENT INDEX VS. S&P 500. Note the uptrends in the S&P 500 coincide with a BPI greater than 50. The downtrend in the S&P 500 coincides with an S&P 500 BPI of less than 50.Chart source: StockCharts.com. For educational purposes.

In the last year, besides the pullback periods in the S&P 500, the bulls have had the upper hand. If you wanted to invest in an S&P 500 stock when the bulls were in control, your first task is to find one that aligns with the bullish move.

Rule 3: Buy on Up Days, Sell on Down Days

Let’s focus on the period between August 9, 2024, and December 18, 2024, to coincide with the period when the BPI was greater than 50 and examine a hollow candlestick chart of Apple, Inc. (AAPL), one of the top cap-weighted stocks in the S&P 500.

FIGURE 3. DAILY CHART OF APPLE STOCK. From August 9 to December 18, 2024, which coincides with the S&P 500 BPI > 50, the stock price trended higher, displaying a series of hollow green candles at the front and tail end of the period.Chart source: StockCharts.com. For educational purposes.

Hollow candlestick charts are visually interesting and have the advantage of identifying a trend quickly. The upward movement began a few days before August 9, when there was a significant gap down in AAPL’s price. Even though it was a down day, the bar was hollow, which means the close was higher than the open.

Looking at all three charts, August 9 presented an opportune buy signal. It aligned with the bullish BPI and the long-term trend in the weekly and daily charts.

If you had hypothetically opened a long position, you could have exited your position on December 18, when the BPI turned bearish and made a decent return. You could have held on for a few more days, but the stock sold off quickly, so your exit would depend on how well your sell order got filled.

Regardless, you should have exited the position during the series of down days that started on December 27. If you hadn’t closed your position then and were still holding on to it, you would have been caught in the downward spiral that started when the S&P 500 BPI fell below 50 on February 27.


StockCharts Tip

Hollow candlestick charts differ from the traditional filled candlestick charts. To apply hollow candle charts, click the Hollow Candles button under Chart Attributes.


The Bottom Line

Given the erratic nature of the stock market, especially an over-extended one, a smart approach to investing requires following a set of rules. It doesn’t have to be complicated.

Identifying the long-term trend, checking the market’s breadth, and ensuring the trend of a stock you want to buy aligns with the overall market is a simple approach, but applying it successfully in real time takes practice. Practice applying the rules using a simulated account. There’s no better teacher than yourself.


Disclaimer: This blog is for educational purposes only and should not be construed as financial advice. The ideas and strategies should never be used without first assessing your own personal and financial situation, or without consulting a financial professional.

Lobo Tiggre, CEO of IndependentSpeculator.com, shares his latest thoughts on gold, noting that bullish factors are stacking up in its favor. Among them are recent moves from the Trump administration, and a potential rise in global allocations to gold.

Tiggre also discusses copper, and gives brief thoughts on silver and uranium.

Watch the interview above for more from Tiggre on those topics and more.

Securities Disclosure: I, Charlotte McLeod, hold no direct investment interest in any company mentioned in this article.

This post appeared first on investingnews.com

(TheNewswire)

Vancouver, British Columbia TheNewswire – March 10 2025 Prismo Metals Inc. (CSE:PRIZ, OTCQB: PMOMF) ( ‘ Prismo ‘ or the ‘ Company ‘ ) is pleased to announce that it has completed its previously announced debt settlement transactions with certain creditors of the Company (the ‘ Creditors ‘), pursuant to which the Company has issued to the Creditors an aggregate of 4,451,175 common shares of the Company (‘ Common Shares ‘) at issue prices ranging from $0.075 to $0.23 per Common Share in full and final settlement of accrued and outstanding indebtedness in the aggregate amount of approximately $464,409 (the ‘ Debt Settlement ‘).

All Common Shares issued pursuant to the Debt Settlement will be subject to a statutory hold period of four months from the date of issuance.

None of the foregoing securities have been and will not be registered under the United States Securities Act of 1933, as amended (the ‘ 1933 Act ‘) or any applicable state securities laws and may not be offered or sold in the United States or to, or for the account or benefit of, U.S. persons (as defined in Regulation S under the 1933 Act) or persons in the United States absent registration or an applicable exemption from such registration requirements. This news release does not constitute an offer to sell or the solicitation of an offer to buy, nor will there be any sale of the foregoing securities in any jurisdiction in which such offer, solicitation or sale would be unlawful.

About Prismo

Prismo (CSE: PRIZ) is mining exploration company focused on two precious metal projects in Mexico (Palos Verdes and Los Pavitos) and a copper project in Arizona (Hot Breccia).

Please follow @PrismoMetals on , , , Instagram , and

Prismo Metals Inc.

1100 – 1111 Melville St., Vancouver, British Columbia V6E 3V6

Contact:

Alain Lambert, Chief Executive Officer alain.lambert@prismometals.com

Steve Robertson, President steve.robertson@prismometals.com

Copyright (c) 2025 TheNewswire – All rights reserved.

News Provided by TheNewsWire via QuoteMedia

This post appeared first on investingnews.com

New Age Exploration (ASX: NAE) (NAE or the Company) is pleased to announce the successful completion of additional geophysical surveys at its highly prospective Wagyu Gold Project in the Pilbara, WA. The Passive Seismic (Tromino) and Ground Gravity surveys were conducted across the dry Yule River bed, facilitating a deeper understanding of the geological structures and linking data from both sides of the project area.

HIGHLIGHTS

  • Completion of Passive Seismic and Ground Gravity surveys across the dry Yule River bed at the Wagyu Gold Project in Pilbara, WA
  • Several new gravity anomalies have now been identified, which may indicate the presence of more gold-mineralised intrusions, similar to those intersected in 2024 aircore drilling
  • Enhanced geological connectivity established by linking data from the east and west sides of the tenement
  • Both geophysics surveys were completed with “zero impact” on this culturally sensitive area
  • This is the third ground gravity survey and the second passive seismic survey to take place at the Wagyu Project, with previous surveys outside the river completed in April and May 2024
  • Additional targets 8 and 10 confirmed on east side of the project from gravity survey
  • 3000m of Reverse Circulation Drilling to commence imminently
  • The Wagyu Project is located in the Central Pilbara’s fast-emerging gold region, adjoining De Grey Mining (ASX:DEG) tenure containing its ~11.2Moz1 Hemi Gold deposit

The Wagyu Gold Project, located within a fast-emerging gold mineralised corridor, represents a highly prospective Gold opportunity ~9km within the same mineralised trend as De Grey Mining’s (ASX:DEG) Hemi Gold Deposit containing ~11.2 Moz1 (refer to Figure 1) in the Central Pilbara.

The Hemi Gold Mineral Resource was last updated by De Grey Mining on 14 November 20241. The estimate is for 264Mt @ 1.3g/t Au for 11.2Moz, which can be broken down into 13Mt @ 1.4g/t for 0.6Moz, 149Mt @ 1.3g/t Au Indicated for 6.3 Moz, and 103Mt @ 1.3g/t Au for 4.3 Moz Inferred.

NAE confirms that it is not aware of any new information or data that materially affects the information included in De Grey’s reported Mineral Resources referenced in this market announcement. To NAE’s full knowledge, all material assumptions and technical parameters underpinning the estimates in the relevant market announcements continue to apply and have not materially changed.

NAE Executive Director Joshua Wellisch commented:

‘The completion of these Geophysical Surveys and identification of new targets marks a pivotal step in our exploration efforts and stakeholder relations at Wagyu. With the support of the Kariyarra People, we have gathered data that links structures and anomalies across the tenement, providing a foundation of our geological understanding. We look forward to using these insights to unlock further potential at Wagyu in the lead up to the imminent 3000m RC Drill Programme.”

Geophysical Surveys and Geological Continuity

The Passive Seismic (Tromino) and Ground Gravity surveys at Wagyu have provided valuable data across the Yule River bed, enhancing the geological connectivity between the east and west portions of the tenement. The Passive Seismic survey, conducted at 200-meter intervals across nine lines, offers insights into bedrock continuity, while the Ground Gravity survey (Figure 4), with spacings of 200m x 200m and infill at 50m x 50m over specific targets, reveals density contrasts associated with mineralisation.

Click here for the full ASX Release

This post appeared first on investingnews.com

At the 2025 Prospectors and Developers Association Conference, the panel “Copper vs. Gold: Which Metal Will Outperform?” tackled the question of which metal holds greater investment potential.

Moderated by Gracelin Baskaran, director of the Critical Minerals Security program at the Center for Strategic and International Studies, the discussion brought together industry experts to weigh the risks and rewards of both commodities.

Last year, gold and copper crossed key price milestones, with gold surging past US$2,700 per ounce and copper exceeding US$5 per pound. While gold is primarily seen as a financial safe haven in times of geopolitical uncertainty, copper is an essential industrial metal, increasingly central to resource nationalism and critical mineral security.

For investors, both metals present opportunities, but understanding their distinct market drivers remains crucial.

Gold and copper’s shared influences

Over the past several years, global uncertainty has been fueling an unprecedented run in the gold price.

Among the factors have been high inflation in the fallout of the COVID-19 pandemic, a three-year war between Russia and Ukraine, conflict between Israel and Gaza that has threatened to spread throughout the Middle East and economic instability sparked by the US under President Donald Trump.

Many of these same issues are impacting the copper market. COVID-19 caused spikes in inflation that have impacted a downturn in real estate development worldwide, while shipping routes have had to be altered to avoid conflict zones. Most recently, US tariffs could upend a variety of industries around the world, including the US housing market.

While these influences largely affect the demand side of commodities, the supply side is also being affected similarly. Most notably, declining grades for both copper and gold are driving up overall mining costs and ultimately eating into corporate balance sheets.

The case for copper

The biggest strength for investors in the copper sector is the supply-and-demand situation.

While copper demand growth has only slightly increased in the past few years, it has been largely held back by weakness in the Chinese real estate sector, which is traditionally one of the largest demand drivers for copper.

Despite this, demand is increasingly coming from rapid urbanization as the global population grows and younger people move to cities from rural areas at higher rates than previous generations. Additionally, demand from the tech sector is also up in several areas, including energy transition, artificial intelligence, and data centers.

Frank Nikolic, vice president of battery and base metals at CRU North America, explained that this demand was critical to copper’s value over the next few years.

“Prior to 1990 we had relatively flat or slow growing intensity of copper use per person on the planet. Then after 1990 when the world opened up with the departure of communism from the global stage, in a big way, we’ve seen the massive exposure from computers, the internet boom, the China miracle, I call it the great urbanization, and then finally the last five years or more decarbonization,” he said.

Nikolic suggested that recent growth in copper markets is owed to growth in China, but over the next five years that will begin to shift as there is increased demand from decarbonization technologies.

He also pointed to increasing wealth in the global south, specifically Indonesia, India and South America that will provide additional demand for copper.

Nikolic also acknowledged that while copper will remain in a supply-and-demand surplus over the next year, it will begin shifting into a deficit position. This will require 6 to 8 million metric tons to be added to the market over the next 10 years, but there will be significant challenges to meeting that demand.

“The filling of the demand gap is going to be a lot more expensive than in the past. We’ve seen a massive explosion of capital costs for copper, both greenfield and brownfield, and the cost to operate these assets is also increasing,” he said.

These rising costs are also being met with declining grades and depleting deposits that will require US$100 million per year just to maintain current demand growth. Nikolic also suggests that scrap substitution isn’t likely to provide much relief, noting that it’s barely keeping up with demand as it is.

David Strang, executive chairman of Ero Copper (TSX:ERO,NYSE:ERO), supported Nikolic’s views, particularly on the expansion of the global south, by providing a history of how technology impacted copper in the mid-20th century.

There was a shift beginning in the late 1940s, when homes in the West stopped having milk delivered and instead went to the grocery stores. The advent of refrigeration reduced the necessity for daily deliveries.

Adding this new technology required copper not only in the refrigerator itself but also in the electrical demands on homes and stores.

Strang pointed to India and Indonesia, which have growing economies and an expanding middle class. However, many are still without what the West would call necessities like cell phones and refrigeration.

He sees a fundamental imbalance in the copper market as this newfound wealth drives demand growth not seen since the middle of the last century.

“So here is the thing: Copper is in crisis. If the world is going to continue to where it needs to be with these economies, we need to find more copper. There are only two things that are going to affect that. One is technology, and the other is the metal price has to go up because we cannot continue to live the way we want to live with regards to the other countries that are growing as quickly as they’re growing,” Strang said.

The case for gold

Moving away from the red metal, panelist Jason Attew, president and CEO of Osisko Gold Royalties (TSX:OR,NYSE:OR), argued for investing in gold.

Marking a stark difference between the fundamentals of copper and gold, Attew pointed out that copper was largely influenced by supply and demand. He questioned if copper would be in as strong a position if the US were to go bankrupt, which he sees as a distinct possibility.

He noted that the US has US$36.5 trillion in federal debt versus US$29.1 trillion in gross domestic product (GDP), a debt-to-GDP ratio of 125 percent.

“This is the highest level since the end of World War Two … This translates to over US$650,000 per US family. It’s just remarkable. This ratio has climbed steadily since the pandemic began in 2020 when the federal government debt was approximately US$20 trillion and GDP was US$21 trillion,” he said.

Attew suggests that the pandemic and the subsequent stimulus raised inflation, requiring the US Federal Reserve to raise interest rates.

The broad picture he painted is one of the US economy on the edge of a cliff with few solutions. One possible remedy presented by Attew is to increase the money supply, but that would come with the caveat of devaluing the dollar strength, which is where his backing of gold comes in.

“Everyone knows that US dollar strength has an inverse correlation with the price of gold in real terms, all of which is very constructive for gold. So even if it’s not as doom and gloom as I said… we’re headed to a recession in the US, and it’s very challenging or difficult to see how a soft landing is going to happen here,” Attew said.

Lawson Winder, senior metals and mining research analyst with Bank of America (NYSE:BOC) Securities, agreed with Attew but added that gold was also more attractive beyond what was happening in the United States and that it provides a tangible asset in times of uncertainty.

This has led to enormous purchases by central banks, which Winder suggests is at its highest point in history. It has also led to retail purchases by Chinese and Indian consumers seeing the highest increases he’s ever seen. However, these increases in gold buying have yet to materialize with Western investors, but Winder thinks that will change.

“As the confusion with Trump and tariffs takes hold, we think Western investors will increasingly want to own more physical gold and will likely express it through these means, and will ultimately contribute to a higher gold price,” he said.

What does it mean for investors?

Both copper and gold hold their advantages and risks, and the panelists made effective cases for each metal.

The world is living through economic and geopolitical uncertainty, causing investors to turn to gold to maintain balance in their portfolios and reduce risk. Gold is unlikely to change its status as a haven asset in the near future.

The presenters also made a case for copper based on its fundamentals. Copper is a necessary commodity that powers a world that needs more electricity. Demand is up, and supply is becoming more expensive and harder to find.

Conversely, gold offers investors more options, from physical and paper ownership to equities and ETFs, while copper is largely limited to just equities and a small number of ETFs.

Ultimately, the case for both metals is strong, and given the global situation, both could provide investors with excellent opportunities in 2025.

Securities Disclosure: I, Dean Belder, hold no direct investment interest in any company mentioned in this article.

This post appeared first on investingnews.com

All but one of the world’s top 20 most polluted cities last year were in Asia, a new study shows.

The majority of these cities – 13 – are in the world’s most populous country, India, where booming economic growth is fired largely by coal and where hundreds of millions live in traffic-clogged and congested megacities.

Another four are in neighboring Pakistan, with one in China and Kazakhstan respectively.

The only city outside of Asia featured on the list is N’Djamena, the capital of Chad in central Africa – which was named the country with the worst air pollution.

Meanwhile the cities with the worst pollution in North America were all in California.

The report by IQAir, a Swiss company that tracks global air quality, looked specifically at fine particulate matter, or PM2.5, one of the smallest but most dangerous pollutants.

PM2.5 comes from sources like the combustion of fossil fuels, dust storms and wildfires. It is so tiny – 1/20th of a width of a human hair – that it can travel past your body’s usual defenses into your lungs or bloodstream.

The particles cause irritation and inflammation and have been linked to respiratory problems and chronic kidney disease. Exposure can cause cancer, stroke or heart attacks and has been associated with a higher risk of depression and anxiety.

The World Health Organization (WHO) says average annual levels of PM2.5 should not exceed 5 micrograms per cubic meter.

Byrnihat, an industrial town in northeast India recorded a PM2.5 concentration of 128.2 last year – more than 25 times the WHO’s standard.

She blamed factories around the town and a booming construction industry and trees being felled as contributing to the toxic air.

“The pollution is particularly bad right now, visibility is not great, there is dust everywhere, my eyes also burn,” she said.

“I do not leave home without a mask.”

Twelve other cities in the top 20 are in India.

Its capital New Delhi featured as the world’s most polluted capital for the sixth consecutive year, with a PM2.5 concentration of 91.8. The report also listed six satellite cities – Faridabad, Loni, Delhi, Gurugram, Noida and Greater Noida – making the list.

Just last November, a throat-searing blanket of smog settled over Delhi, disrupting flights, blocking buildings from view and prompting the city’s chief minister to declare a “medical emergency.”

But overall, India – the world’s most populous nation with 1.4 billion people dropped from third to fifth place from the previous year, according to the report.

But the report said air pollution “remains a significant health burden… reducing life expectancy by an estimated 5.2 years.”

India’s neighbors Bangladesh and Pakistan – together home to some 400 million people – were second and third-most polluted countries globally in terms of PM2.5 molecules, according to the report.

China – which used to dominate global rankings of the world’s worst air – noted a small improvement, the report said.

Its national annual average PM2.5 concentration decreased from 32.5 micrograms per cubic meter to 31, with air quality improving in megacities like Beijing, Shanghai, Chengdu, Guangzhou and Shenzhen, the report said.

China is the world’s largest carbon dioxide emitter but in recent years has waged a campaign against air pollution, particularly in the cities that have fuelled its economic growth, and has pushed a massive expansion in solar and wind power.

But last month two clean-energy groups raised alarm over what they said were plans by China’s power industry to build nearly 100 gigawatts of new coal plant capacity last year, the most in nearly a decade.

All 20 of the world’s most polluted cities last year exceeded WHO PM2.5 guidelines by over 10 times, the IQ Air report showed.

Data gaps

“Air pollution remains a critical threat to both human health and environmental stability, yet vast populations remain unaware of their exposure levels,” said Frank Hammes, Global CEO of IQAir.

Iran and Afghanistan did not feature in this year’s report due to a lack of data availability.

Air quality monitoring in Southeast Asia is also a problem, with nearly all countries having “significant gaps in government-led initiatives,” the report found.

In 2024, 173 out of 392 cities in the region lacked government monitoring stations, while Cambodia had none, it said.

Those problems are likely to be exacerbated after the US announced earlier this month that it would stop sharing air quality data gathered from its embassies and consulates worldwide due to “funding constraints” the Associated Press reported.

“Air quality data saves lives,” said Hammes.

“It creates much needed awareness, informs policy decisions, guiding public health interventions, and empowers communities to take action to reduce air pollution and protect future generations.”

Worst cities in North America

Only 17% of 8,954 cities analyzed globally by IQAir recorded air quality which met WHO pollution guidelines, the report said.

The cities with the worst air pollution in North America were Ontario, Bloomington and Huntington Park – all in California, the report said.

Overall the United States saw a significant reduction in PM2.5 levels last year, with the annual average dropping 22% from 2023.

Northern America has long boasted vigorous air quality monitoring systems, contributing 56% of the total number of ground-based air quality monitoring stations included in the IQ Air report – helping scientists with their continued research on air quality and aiding policymakers to make decisions about public health.

Only 12 countries, regions, and territories recorded PM2.5 concentrations below the WHO guidelines, most of which were in the Latin America and Caribbean or Oceania region.

The report called on governments to dedicate funding for renewable energy projects and “strengthen emission limits for vehicles and industrial activities.”

Advice Suman wishes authorities in Byrnihat would take to save her city from appearing at the top of the most polluted list again next year.

“This is my birthplace. I am a local. I do not want to leave this area. We want the governments to do more, come together and work for us.”

This post appeared first on cnn.com

Elections in Greenland, an island home to about 57,000 people, are usually a local affair.

There is little opinion polling, with only two newspapers in the Danish autonomous territory. Greenlanders mull over politics in private Facebook groups, with key issues in the past centering on the economy, mining, fishing law and of course, its relationship and history with Denmark.

But as Greenlanders head to the polls on Tuesday, US President Donald Trump’s idea to annex the nation has thrown this year’s elections into the international spotlight.

Speaking about Greenland in his speech to Congress last week, Trump said, “I think we’re going to get it one way or the other” – reigniting fears of the United States attempting to take the island by force or economic coercion.

Greenland’s pro-independence Prime Minister Mute Egede responded: “We are not for sale and cannot simply be taken.”

“We don’t want to be Americans, nor Danes; We are Kalaallit (Greenlanders),” Egede said. “The Americans and their leader must understand that.”

In fact, all five parties in Greenland’s parliament have said they do not want the territory to become part of the United States. Their key divisions center more on economic, social and environmental policy than Trump’s pronouncements.

The dominant parties on Greenland’s political spectrum all agree on the desire for independence, with many parties, including Egede’s ruling democratic socialist party Inuit Ataqatigiit, viewing it as a long-term project, requiring years of negotiation with Denmark and further economic improvement.

Denmark ruled Greenland as a colony until 1953, when the island achieved greater powers of self-governance. Then, in 2009, it gained more powers pertaining to minerals, policing and courts of law. But Denmark still controls security, defense, foreign and monetary policy. Greenland also benefits from Denmark’s European Union and NATO memberships.

It is an open question what Greenland’s future security will look like if it votes to break away. Some politicians have floated establishing a post-independence defense treaty with Denmark, Canada, or even the United States, which already has a military base in the Arctic Circle in far northwest Greenland.

The island’s future security is especially important as Russia and China vie for greater influence in the Arctic.

Speeding up independence movement

In almost every election in recent years, politicians have promised to take steps to achieve autonomy. None of them have offered a concrete timeline, though.

But Trump’s aggressive stance has actually given the Arctic nation more bargaining power with Denmark, analysts say, and kicked the independence movement into high gear.

Independence isn’t on the ballot for Tuesday’s election, but the other partner in Greenland’s two-party government coalition, the Siumut party, has said it plans to hold a referendum on independence within the next election period. The main opposition party, Naleraq, has campaigned to sever ties with Denmark more quickly and wants to pursue a defense agreement with the US.

Greenland holds elections every four years, with 31 seats in parliament at stake.

Without reliable election polling, analysts hesitate to predict if Egede’s ruling left-wing coalition will win again.

“Whatever the outcome is going to be, there will be speed, there will be turbo on the issue of independence,” Noa Redington, an analyst and former adviser to previous Danish prime minister Helle Thorning-Schmidt, told Reuters news.

Greenlandic social media influencer and candidate for Naleraq, Qupanuk Olsen, told Reuters: “I strongly believe all this interest from Trump and the rest of the world is definitely speeding up our independence process times 100.”

Meanwhile, amid the influx of international attention, Greenland’s parliament last month outlawed political donations from foreign individuals and anonymous donors.

Danish intelligence services have announced they are actively monitoring attempts by foreign powers to interfere in the elections, citing China, Russia and the United States as potential tampering powers.

With multiple issues at play, “it has never been so important to mark a ballot,” wrote journalist Tôrtia Reimer-Johansen for the nation’s weekly newspaper Sermitsiaq.

‘Greenlanders have felt trapped’

A key issue is how full independence could be achieved and whether it’s economically viable, given that Greenland receives roughly 20% of its annual GDP from a Danish block grant every year – more than $500 million. That’s about half the island’s public budget.

Greenlanders also have Danish passports, healthcare and other Nordic welfare state benefits.

Analysts say any independence referendum would likely take years to implement and require lengthy exit-deal negotiations.

“Greenlanders have felt trapped, not just constitutionally, but also in terms of any kinds of relation, particularly economic relations,” said Ulrik Pram Gad, a senior researcher focused on Greenlandic-Danish relations at the Danish Institute for International Studies.

While Greenlandic politicians have repeatedly signaled that they’re uninterested in annexation, they are open to deals with the United States for rare earth mining, expanding tourism, stronger diplomatic connections and other investments.

Trump said in a social media post on Sunday: “We are ready to INVEST BILLIONS OF DOLLARS to create new jobs and MAKE YOU RICH,” he added, inviting Greenland to become “a part of” the United States.

Greenland is rich in oil and gas, as well as the rare earth metals in high demand for electric cars, wind turbines and manufacturing military equipment.

“They’re really eager to get someone digging, but they want to be sure to have a piece of the cake,” Gad added.

“Under the current Danish constitution and the self-government act, Greenland is in charge of minerals. They can dig up and export whatever that they want, but Denmark is in charge of security. That is kind of a stalemate, in the sense that, if you dig up something which is a security problem, who’s then to decide?” he said.

Security far from the only issue

Beyond security and foreign policy issues, Nuuk’s relationship with Copenhagen has also been fraught with allegations of historical misconduct and colonial oppression of the indigenous Inuit Greenlandic people.

The nation has been rocked in recent years by a birth control scandal, after it came to light that Denmark fitted many Greenlandic girls with an intrauterine device (IUD) in the 1960s and 70s without girls’ or their parents’ permission, as a means of population control. Prime Minister Egede recently called the birth control campaign “a genocide.”

And this election cycle has also exposed frustration over allegations that Denmark profited off a large cryolite mine on Greenland’s west coast from 1854 until 1987 – exploiting the area without benefiting locals.

A University of Greenland opinion survey conducted in spring 2024 – months before Trump floated ideas to control the island – found that more people saw the security threat as high compared to 2021. The survey also illuminated views on Greenland’s desire for greater international cooperation, with locals saying their preferred partners were Iceland, Canada and the Arctic Council.

Even still, people surveyed in 2024 said the biggest challenges for Greenland were the economic situation, cost of living and unemployment.

Those views have almost assuredly shifted in 2025, as Trump argues that controlling Greenland is vital for US national security and refuses to rule out using military force.

But the election is inherently unpredictable. The key issues on Greenlander’s minds may only become clear when results begin to trickle out of local polling stations in the early hours of Wednesday.

This post appeared first on cnn.com