Archive

December 31, 2024

Browsing

There are a number of effective swing trading systems being used today. Let’s explore one that is popular among Wyckoffians. It uses two inputs: Point and Figure charts and volume. Let’s review this system with a case study of Charles Schwab Corp. (SCHW).

As markets are fractal, Accumulation and Distribution structures form in daily, weekly and monthly timeframes. Swing trading structures typically form on daily charts that can be identified with 1-box Point & Figure charts and daily vertical bar charts.

Charles Schwab Corp. forms a Swing Trading Accumulation structure between July and October. In July climactic selling (SC) volume ends the decline, and an Automatic Rally (AR) sets the support and resistance of a range-bound condition to follow. Subsequent volume on rallies and reactions tells the tale of latent Accumulation. This chart is rich with Wyckoffian principles, and it has been marked up for your study and evaluation. Let’s turn our attention to the PnF chart to demonstrate how much useful information is present for Swing Trading.

Charles Schwab Corp. (SCHW) Vertical Chart Study

Swing PnF Case Study

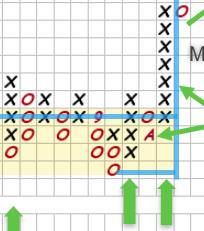
Charles Schwab Corp. Swing Trading Case Study. 1-Box PnF

A 1-box PnF chart, properly constructed, will characterize the essential elements of the vertical chart. Note how the PnF strips out much of the noise and highlights the critical chart features. I often hear that traders find volume easier to read and interpret on the PnF chart therefore it is suggested that all PnF charts be plotted with volume. A key feature of PnF charts is the estimation of the price objective determined by the size and structure of the Accumulation. There is no other technique for estimating price objectives as effectively as horizontal PnF counting. PnF is a centuries old, tried and true approach to evaluating and trading financial instruments.

For swing trading purposes, a 1-box reversal PnF is generated using ‘Traditional Scaling’. The up and down swings are clearly revealed with this method. With 1-box PnF the horizontal structure is well defined and the volume patterns are illuminating.

Chart Notes:

  • Selling Climax (SC) exceeds the Distribution count and finds support at $61. An Automatic Rally (AR) immediately follows and demonstrates emerging demand. A Secondary Test (ST) back to $61, which holds, and confirms this level to be the Composite Operator’s ‘Value Zone’. Volume declines on each reaction back to $61 ST level (support).
  • Volume expands on each rally (column of X’s) as the Accumulation matures to conclusion. Lower volume on declines and higher volume on the rally columns reveal that supply is diminishing and absorption has occurred. Higher volume on the rising columns is evidence of new demand by institutions. Accumulation is nearly complete.
  • The pullback to the LPS / BU (see vertical chart) produces a higher low. The turn off that low can be bought with a stop below support. The next entry level is the jump above $65 resistance with a stop below the LPS.
  • The price objective generated by the horizontal Accumulation is estimated by the PnF. There are 17 columns of count producing $17 of upside price objective (17 columns x $1-scale x 1-point reversal = $17). The percent potential of this swing trade is $17 from the $64 count line ($17/$64 = 26.6%). The price objective range is estimated by adding $17 to the $61 low of the Accumulation and the $64 count line. Producing a count range of $78 / $81.
  • The Buying Climax is reached at $82. Thereafter $83 is resistance and a Swing Distribution forms in this price zone. When the Swing PnF count objective is attained, profits are taken. In this example the local Buying Climax surge produces an ideal selling zone.

Campaign PnF Case Study

Charles Schwab Corp. Campaign PnF Case Study. 3-Box Method

Stepping out to the larger timeframe is essential. Please study this 3-box reversal PnF. It reaches back into 2022. A Campaign PnF Count Accumulation has potential objectives of up to $101 / $105. Also, the prior high is $83 which happens to be in the area of the Swing PnF price objective and natural resistance. Be on the alert for the generation of a new Swing PnF count structure in the months ahead. Often these Swing counts will coincide with the higher Campaign PnF counts. We will be watching.

All the Best,

Bruce

@rdwyckoff

A Very Happy and Prosperous 2025 to You and Yours!

Disclaimer: This blog is for educational purposes only and should not be construed as financial advice. The ideas and strategies should never be used without first assessing your own personal and financial situation, or without consulting a financial professional. 

Announcement

Wyckoff Analytics will launch the Spring Semester of their legendary Wyckoff Trading Courses (WTC). The first session of WTC-1 is Complimentary (Click Here to Register for the Free Session). To learn more about these courses and other offerings Click Here.

It’s an interesting market day with the market moving lower despite positive seasonality. Natural Gas (UNG) broke out in a big way up over 15% at the time of writing. Is it ready to continue its big run higher?

Carl took the day off so Erin gave us the review of the signal tables and market charts. She then gave us her perspective on the Natural Gas (UNG) chart. As of writing, we have determined that the big move is due to geopolitical tensions over the expiration of LNG exports with Russia for Europe. This could mean more exports and demand for US Natural Gas.

Erin then covered Sector Rotation and walked us through all of the sector charts “under the hood”. No sectors currently have rising momentum. All Price Momentum Oscillators (PMOs) are in decline setting up for a very difficult January.

Try out any of the DP products for two weeks for free using Coupon Code: DPTRIAL2.

01:40 DP Signal Tables

04:38 Market Overview (including Bitcoin, Yields, Dollar, Gold and more)

24:40 Questions

26:52 Natural Gas (UNG)

33:04 Sector Rotation Overview

35:02 Magnificent Seven

41:37 Sector Chart Review Under the Hood

50:13 Symbol Requests

Join us LIVE in the trading room on Mondays at Noon ET by registering once to attend: https://zoom.us/webinar/register/WN_D6iAp-C1S6SebVpQIYcC6g#/registration


The DP Alert: Your First Stop to a Great Trade!

Before you trade any stock or ETF, you need to know the trend and condition of the market. The DP Alert gives you all you need to know with an executive summary of the market’s current trend and condition. It not only covers the market! We look at Bitcoin, Yields, Bonds, Gold, the Dollar, Gold Miners and Crude Oil! Only $50/month! Or, use our free trial to try it out for two weeks using coupon code: DPTRIAL2. Click HERE to subscribe NOW!


Learn more about DecisionPoint.com:


Watch the latest episode of the DecisionPointTrading Room on DP’s YouTube channel here!


Try us out for two weeks with a trial subscription!

Use coupon code: DPTRIAL2 Subscribe HERE!


Technical Analysis is a windsock, not a crystal ball. –Carl Swenlin


(c) Copyright 2024 DecisionPoint.com


Disclaimer: This blog is for educational purposes only and should not be construed as financial advice. The ideas and strategies should never be used without first assessing your own personal and financial situation, or without consulting a financial professional. Any opinions expressed herein are solely those of the author, and do not in any way represent the views or opinions of any other person or entity.

DecisionPoint is not a registered investment advisor. Investment and trading decisions are solely your responsibility. DecisionPoint newsletters, blogs or website materials should NOT be interpreted as a recommendation or solicitation to buy or sell any security or to take any specific action.


Helpful DecisionPoint Links:

Trend Models

Price Momentum Oscillator (PMO)

On Balance Volume

Swenlin Trading Oscillators (STO-B and STO-V)

ITBM and ITVM

SCTR Ranking

Bear Market Rules


Ongoing surpluses in the lithium market continued weighing down prices and impeding the sector’s growth throughout 2024.

A broad consolidation prompted analysts to declare that prices have bottomed, signaling a potential recovery ahead.

According to a Sprott Insights report from late July, a lithium shortage could materialize in 2025 and will be exacerbated by the lack of new production able to ramp up quickly.

“There are currently only 101 lithium mines in the world, and even as more mines and exploration projects come online, the added supply may likely not be able to keep up with demand,” Jacob White wrote.

Demand from China alone is projected to climb by nearly 20 percent annually over the next decade.

The impact of lithium shortages may also be heightened by the low-price environment that has plagued the market in 2024.

“This is especially evident given that the current unsustainably low lithium prices have led to project curtailments and driven some miners to reduce capital expenditures and investments in future supply,” White noted. “We believe that the lithium price may have bottomed, and higher lithium prices may be necessary to incentivize the required future production.”

1. Q2 Metals (TSXV:QTWO)

Company Profile

Year-to-date gain: 220 percent
Market cap: C$106.11 million
Share price: C$0.80

Exploration firm Q2 Metals is exploring its flagship Mia lithium property in the Eeyou Istchee James Bay region of Québec, Canada. The property contains the Mia trend, which spans over 10 kilometers. Also included in Q2 Metals’ portfolio is the Stellar lithium property, comprised of 77 claims and located 6 kilometers north of the Mia property.

In 2024, Q2 Metals also focused on exploring the Cisco lithium property, which is situated in the same region. On February 29, the company entered into three separate option agreements to gain a 100 percent interest in Cisco. The news caused its share price to skyrocket, reaching a Q1 high of C$0.54 on March 4.

Q2 Metals closed the acquisition of Cisco in June and now wholly owns the project.

In mid-May, the company announced the start of a summer drill program at the Cisco property. It has since released multiple significant updates, including the confirmation of eight new mineralized zones on July 8.

On October 1, Q2 released assays from the drill program, and its share price spiked on the news, ultimately climbing to an all-time high of C$1.48 on October 11.

“These assays continue to validate the potential and scale of the Cisco Property as that of a larger mineralized system,” said Neil McCallum, vice president of exploration. “One important observation of these results is the higher-grade nature of the larger mineralized system as we test and track the system progressing to the south.”

By the end of the drill program, the company had drilled 17 holes covering 6,360 meters in total, and it released the final results from the campaign on December 17.

As of mid-December, Q2 now has the exclusive right to acquire a 100 percent interest in 545 additional mineral claims, which would triple its land position at the Cisco lithium property. The new claims, located south of the original property, enhance prospects for development and future mining infrastructure.

2. Power Metals (TSXV:PWM)

Press ReleasesCompany Profile

Year-to-date gains: 73.08 percent
Market cap: C$67.57 million
Share price: C$0.45

Exploration company Power Metals holds a portfolio of diversified assets in Ontario and Québec, Canada.

In late February, Power Metals commenced a winter drill program at its Case Lake property in Northeastern Ontario. The program was designed to expand and define lithium-cesium-tantalum (LCT) mineralization, building on previous work that revealed high-grade lithium and cesium mineralization.

Company shares rose to an H1 high of C$0.47 at the end of March coinciding with news that Power Metals had staked the 7,000 hectare Pelletier project, consisting of 337 mineral claims in Northeast Ontario. According to the company, the project features LCT potential, with peraluminous S-type pegmatitic granites intruding into metasedimentary and amphibolite formations.

During Q4, Power Metals identified a new pegmatite zone at Case Lake through soil sampling. The samples from the zone, located north-northwest of its West Joe prospect, revealed elevated levels of cesium, tantalum, lithium and rubidium, highlighting promising drill targets for the winter program.

The company has also launched its Phase 2 drone magnetic survey, to refine its structural model for critical mineral targets at West Joe and the Main Zone ahead of 2025 exploration efforts.

In a December 10 exploration update, Power Metals disclosed that its partner Black Diamond Drilling, a First Nations owned drilling company, had completed a total of 16 drill holes for 971 meters of the planned 2,000 meter program. Environmental studies are also ongoing.

Shares rose over the following week to a year-to-date high of C$0.49 on December 16.

3. Lithium Chile (TSXV:LITH)

Company Profile

Year-to-date gains: 45.28 percent
Market cap: C$163 million
Share price: C$0.77

South America-focused Lithium Chile owns several lithium land packages in Chile and Argentina, including its Salar de Arizaro property in Argentina.

On April 9, Lithium Chile announced a 24 percent increase in the resource estimate for Salar de Arizaro. The new total for the project is 4.12 million metric tons (MT) of lithium carbonate equivalent, categorized as follows: 261,000 MT in the measured category, 2.24 million MT in the indicated category and 1.62 million MT in the inferred category.

Not long after, on April 18, the company reported the creation of two wholly owned Canadian subsidiaries — Lithium Chile 2.0 and Kairos Gold — as part of a spinout to separate its Chilean and Argentinian assets.

Lithium Chile will retain its Argentinian lithium projects, and transfer its 111,978 hectares of Chilean lithium properties to Lithium Chile 2.0 and its portfolio of gold assets in Chile to Kairos Gold.

In a July operational update for the Salar de Arizaro project the company highlighted that a drill hole encountered ‘a brine-rich, sandy formation encountered from 161 to 500-metres.’

An August announcement provided an update, noting the spin out of Lithium Chile 2.0 was reliant on finalizing a strategic deal for the company’s Arizaro property. As for Kairos Gold, its spin out was effective on December 4.

In mid-December, Lithium Chile penned a letter of intent to sell its 80 percent stake of the Argentinian Arizaro lithium project.

While Lithium Chile did not disclose the buyer it was noted that the buyer “is a large, Asian based company founded over two decades ago (and) a diversified enterprise with significant interests in mining, renewable energy, and technology sectors.”

The move to sell its flagship asset signals a significant step in the company’s strategic realignment. Although company shares reached a year-to-date high of C$0.88 in March, the recent sale news has pushed shares into the C$0.80 level.

4. Volt Lithium (TSXV:VLT)

Company Profile

Year-to-date gains: 26.09 percent
Market cap: C$47.53 million
Share price: C$0.29

Volt Lithium is a lithium development and technology company aiming to become a premier North American lithium producer utilizing its unique technology to extract lithium from oilfield brine.

On April 29, Volt announced a strategic investment of US$1.5 million by an unnamed company operating in the Delaware Basin in West Texas, US. This investment is earmarked for the deployment of a field unit to produce lithium hydroxide monohydrate using Volt’s proprietary direct lithium extraction (DLE) technology.

The company’s share price retreated in the second half of Q2, but July 17 news that Volt increased its processing capacity at its operations in Alberta, Canada, by 100 fold to 96,000 liters per day caused its price to shoot up more than C$0.08 during trading that day.

An August announcement from Volt highlighted the deployment and subsequent production scale up of Volt’s DLE technology in the Permian Basin. The field unit’s processing capacity had been increased to 200,000 liters, or 1,250 barrels, of oilfield brine per day on location in West Texas.

At the end of Q3, Volt achieved first lithium production in the Permian Basin. Shares of Volt reached a year-to-date high of C$0.49 on September 26, the day of the announcement.

“Achieving first lithium production establishes Volt as a leader in direct lithium extraction from North American oilfield brines and marks the Company’s strategic shift from development to production,” said Alex Wylie, the company’s president and CEO.

During the fourth quarter the company raised C$6.2 million through a two-tranche private placement.

In mid-December Volt partnered with Wellspring Hydro to test its proprietary DLE technology in North Dakota, US. The field study aims to evaluate the feasibility of extracting lithium from oilfield brine in the Bakken formation.

Volt also released another update on its field operations in Texas, where it had increased processing to more than 2,500 barrels per day. In January 2025, the company expects to commission its next field unit, which will process up to 10,000 barrels per day.

5. Nevada Lithium Resources (CSE:NVLH)

Press ReleasesCompany Profile

Year-to-date gains: 14.89 percent
Market cap: C$62.9 million
Share price: C$0.27

Mineral exploration and development company Nevada Lithium Resources is focused on advancing its flagship Bonnie Claire lithium-boron project, located in Nye County, Nevada, US.

In January, Nevada Lithium released the results of a previously conducted seismic survey. The findings identified “a major north-south-trending fault zone as a target for lithium brine exploration.”

At the beginning of Q2 the company reported the commencement of the updated preliminary economic assessment for Bonnie Claire. Additionally, the company also noted “positive” results from test work on the proposed hydraulic borehole mining method that is being considered for the project.

The company also released several drill hole updates throughout the year highlighting the potential of its asset.

In mid-December, Nevada Lithium filed its mineral resource estimate for Bonnie Claire’s Lower and Upper Zones, which featured significantly increased tonnage and grades. The project’s Lower Zone hosts an indicated resource of 275.85 million metric tons grading 3,519 parts per million lithium and 8,404 parts per million boron.

The company announced on December 27 that it is commencing trading on the TSXV on December 31. The news sent shares to a year-to-date high of C$0.27 that day.

Securities Disclosure: I, Georgia Williams, hold no direct investment interest in any company mentioned in this article.

This post appeared first on investingnews.com

As the year closes, we’re taking a look back at our most popular gold news articles of 2024.

The gold mining industry in 2024 has been marked by turbulence and transformation, reflecting the sector’s resilience amid environmental challenges, regulatory shifts and fluctuating market conditions. The year has underscored the complexities of sustainable mining and its implications for communities and investors alike.

The value of gold rose significantly in 2024, with the gold price setting a long series of new all-time highs throughout the year.

As the year closes, we have revisited our most popular gold news stories from 2024, including updates on what has happened since the news broke.

1. Victoria Gold Placed into Receivership After Heap Leach Pad Failure at Eagle Gold Mine

Victoria Gold’s collapse into receivership following a heap leach pad failure at its Eagle mine in Yukon marked one of the gold sector’s most consequential stories of 2024, and our coverage of the August receivership order was our most popular gold news piece of the year.

The environmental fallout from the June incident has been severe, with cyanide contamination detected in local waterways and reports of fish deaths.

The Na-Cho Nyäk Dun First Nation, whose traditional territory hosts the mine, criticized Victoria Gold’s cleanup efforts, demanding a halt to all mining activities in the region. The Yukon government also took legal steps to assert control over environmental mitigation, citing the company’s noncompliance with directives.

This culminated in an Ontario court approving receivership in August, with PricewaterhouseCoopers (PwC) becoming the receiver and manager of Victoria Gold’s assets. The firm is now overseeing cleanup operations.

On December 9, Ontario Superior Court Judge Barbara Conway approved a US$55 million increase to the receivership budget, bringing the total to US$105 million to fund environmental mitigation through March.

Additionally, PwC has been granted expanded authority to sell non-core assets and appoint technical advisors, further solidifying its role in managing the aftermath of this environmental disaster.

2. Goldman Sachs Bullish on Commodities, Shares 2024 Price Calls for Gold and Copper

In late March, we reported on Goldman Sachs’ (NYSE:GS) outlook on commodities in 2024, in which it cited strong structural and cyclical demand as the main drivers of an anticipated positive market.

The US investment bank projected raw materials would deliver a 15 percent return by year’s end, with particular optimism for gold and copper.

Analysts forecast gold prices to reach US$2,300 per ounce and copper to surpass US$10,000 per metric ton by the end of the year, supported by expected interest rate cuts in the US and Europe. Gold and copper, already performing strongly in Q1, went on to break through those targets in April and May respectively.

Goldman Sachs reiterated its bullish position in September, increasing its price target for gold to US$2,700 per ounce by early 2025. This optimism stemmed from central bank demand and anticipated US Federal Reserve rate cuts.

Gold peaked at US$2,788 per ounce on October 30, one day after the analyst firm predicted that the precious metal would reach US$3,000 per ounce by the end of 2025.

However, gold has experienced volatility in the time since, pulling back on factors such as the November 5 US election, and the US Fed’s December 18 announcement of slowed rate cuts for 2025.

The spot gold price fell by over 2 percent to US$2,585 per ounce following the Fed announcement as the market buzzed with concerns about inflation and tighter monetary policy under the new Trump administration.

3. Metals Focus: Gold Price to Average US$2,250 in 2024, Setting New Record

In the firm’s annual Gold Focus report, released in June, independent consultancy Metals Focus forecast an average gold price of US$2,250 per ounce in 2024, which would be a new record average price for the precious metal.

The report highlights key drivers for gold’s performance, including looming US debt issues, a contentious election season and uncertainty over China’s economic recovery.

Central bank demand, led by Turkey, China and India, remained robust, contributing to gold’s momentum. Geopolitical risks, particularly in the Middle East, also bolstered investor sentiment.

As we know now, gold experienced a historic run in 2024. Gold prices hit a 39 new all-time highs in dollar terms during the year, marking the most record highs in 45 years. Its latest occurred on October 30, when the metal closed at US$2,788.54 per ounce.

Ultimately, the average gold price in 2024 came in well above Metals Focus’ bullish forecast. As of December 30, 2024’s average closing price for spot gold is US$2,388.09, up by 26.5 percent over 2023’s average of US$1,943.

4. Gold from Canada’s Biggest Heist Reportedly Smuggled to India, Dubai

On July 8, 2024, we updated readers on the latest development on the theft of 400 kilograms of gold stolen from Toronto’s Pearson International Airport in April 2023.

At that time, Canadian police revealed they believed a significant portion of the gold had been smuggled to India and Dubai. Peel Region police identified these destinations as primary markets for illicit gold, where it can be melted down and re-enter the global supply chain.

The gold, valued at over C$20 million at the time of the theft, was part of a shipment from Zurich, Switzerland, destined for a Canadian refinery.

The heist has since been dubbed Canada’s largest gold theft and the sixth largest in the world.

Nine arrests had already been made in connection with the theft, with suspects facing more than 19 charges. The police said that the suspects reportedly used a 5 metric ton truck and rudimentary smelting equipment to transport and process the stolen gold.

While not much has come out since, Air Canada (TSX:AC,OTCQX:ACDVF) and secure transit company Brink’s (NYSE:BCO) are embroiled in a lawsuit over who is at fault and who should cover the cost of the lost gold.

5. NYSE Resolves Glitch That Showed 99 Percent Drops for Barrick Gold, Other Stocks

The New York Stock Exchange (NYSE) addressed a technical issue on June 3 that caused misleading price displays for around 50 companies listed on the exchange, including Barrick Gold (TSX:ABX,NYSE:GOLD) and Warren Buffett’s Berkshire Hathaway (NYSE:BRK.A).

The problem stemmed from a malfunction in the exchange’s limit up limit down (LULD) bands, which are designed to curb extreme market volatility by preventing trades outside predefined price ranges.

As a result, some stocks temporarily appeared to experience nearly 100 percent losses during morning trading. NYSE resolved the glitch and the companies were back to trading normally after a brief pause of about 30 minutes.

While it was resolved quickly, there has been fallout from the event, which saw stock traders placing buy orders at the rock-bottom prices during the trade pause that filled at the stock’s usual price or higher when trading resumed.

For example, Reuters reported that Interactive Brokers (IBKR) is down US$48 million after it covered losses for its clients who placed orders for Berkshire Hathaway’s class A shares at US$185 that filled at prices of up to US$741,971, more than US$100,000 higher than its pre-glitch price. The exchange denied Interactive’s request to bust the trades that were completed at ‘anomalously’ high prices.

Securities Disclosure: I, Giann Liguid, hold no direct investment interest in any company mentioned in this article.

This post appeared first on investingnews.com

Looking at the resource sector, Martin, who also hosts the Jay Martin Show on YouTube, said the current decade has been defined by chaos and uncertainty, with no signs of a slowdown any time soon.

With that in mind, his macro thesis on commodities remains steadfast, and he’s watching three key drivers.

The first is geopolitics, which Martin said now matters more than it ever has before.

‘Countries that used to share resources aren’t sharing them like they used to. And when the supply of something becomes uncertain, the price of that thing goes up. That’s fueled a lot of the commodity prices that we’ve seen,’ he said.

Martin also pointed to a lack of investment in the mining industry as important.

‘These two forces butting up against each other makes for a very bullish case,’ he explained.

He also pointed to copper’s bullish supply/demand setup as a scenario that could play out for other metals as well — while the balance has been fairly consistent for decades, it’s now looking like supply is set to fall short.

‘You can take that blueprint and apply it to silver and nickel and many other commodities,’ Martin said.

When it comes to VRIC, there will be three main themes: geopolitics, macro finance and capital allocation in mining. He’s planning to bring together experts who can speak on those topics, and said more than 100 keynote speakers will be taking the stage. Three hundred mining companies are also expected to attend, as well as over 9,000 investors.

Securities Disclosure: I, Charlotte McLeod, hold no direct investment interest in any company mentioned in this article.

This post appeared first on investingnews.com

Copper was trading on the COMEX at under US$4 per pound at the beginning of 2024, but by May 21, the red metal’s price had surged to a record high of US$5.11 per pound.

Price momentum at the start of the year was owed to several factors, including increasing demand from energy transition sectors, bottlenecks at Chinese refiners and near-zero copper treatment charges.

The price was volatile through the second and third quarters, slipping back below US$4 per pound before soaring above US$4.50 at the end of Q3. Read on for more on how copper performed in 2024, from prices to supply and demand.

Copper price in Q4

Copper started the fourth quarter of the year on a strong note. On October 2, the metal reached its quarterly high of US$4.60 before starting a month-long slide to US$4.31 on October 31.

Volatility was the story at the start of November. Copper soared to US$4.45 on November 5 before dropping to US$4.22 on November 6, then spiked to US$4.41 on November 7; finally, it crashed to US$4.05 on November 15.

Copper price, Q4 2024.

Chart via Trading Economics.

While copper did see a couple of rallies as the year ended, it only briefly broke through resistance of US$4.20 from December 9 to 11 before settling toward the US$4 mark at the end of the month.

As of December 23, the copper price was sitting at US$4.02.

Copper concentrate market to stay tight

In an October report, Fastmarkets predicts that the concentrate market will remain tight in 2025.

This tightness will continue to impact refiner treatment charges. Though they are expected to rebound to around US$20 to US$30 per metric ton (MT), they will still be short of the US$80 mark reached in 2023.

The situation has become more challenging as new operations, particularly in China, expand capacity in 2024. Fastmarkets anticipates no change in the situation in 2025, as new smelters are set to come online in China, Indonesia and India. The additional capacity will see more refiners fighting for the available supply.

The research firm says several other factors are contributing to copper concentrate shortages, including the loss of material from First Quantum Minerals’ (TSX:FM,NYSE:FM) Cobre Panama mine after it was ordered shut down in November 2023. Other miners that have cut their production forecasts are also adding to supply woes.

For example, Teck Resources (TSX:TECK.A,TECK.B,NYSE:TECK) revised its copper production guidance when it released its third quarter results on October 23. In its release, Teck indicates that the updated range now stands at 420,000 to 455,000 MT, down from the 435,000 to 500,000 MT estimated at the start of the year.

The company said the reduction was due to challenges with labor availability and problems with autonomous systems in its new haul trucks at its Highland Valley mine in BC, Canada.

China’s economy dragging on copper

A significant headwind for copper at the end of 2024 has been the continued challenges posed by China’s faltering economy. Although the country has introduced stimulus measures, they have made little difference.

The most recent stimulus announcement came on December 24, when the Chinese government announced it would issue US$411 billion worth of special treasury bonds in 2025. This package would be the highest on record, and would represent an increase over the US$137 billion issued in the past year.

The move follows President Xi Jinping’s keynote address at the country’s annual economic policy meeting on December 11 and 12. Xi said at the time that the economy was stable, and that the government would be working to boost consumption through looser monetary policy and more active fiscal policy. Few details were given on how the country would achieve its goals, and the US$411 billion debt injection could be the first sign of that policy.

In addition, in September, the Chinese government announced measures to increase credit, support cities in purchasing unsold homes and restructure debt. These efforts have failed to turn around the world’s second largest economy.

China is the world’s largest copper consumer, and any shift in the strength of the nation’s economy will have implications for the price trajectory of base metal.

How did copper perform for the rest of the year?

Copper price in Q1

Copper supply was in focus in Q1 as First Quantum provided an update on its Cobre Panama mine.

The mine was forced to close at the end of 2023 after the Panamanian Supreme Court walked back a company-friendly deal initially approved in October 2023.

At the beginning of 2024, First Quantum pursued several avenues to resolve the issue and reopen the mine, including arbitration. It also waited for the results of Panama’s May election in hopes of more mining-friendly leadership.

Copper price in Q2

The second quarter was dominated by news of output curtailments at Chinese smelting operations.

The cuts came as lower production levels from copper miners began to stress treatment charges at refiners as they competed for the limited availability of copper concentrate.

In turn, this pushed the price of copper prices higher at major exchanges.

“So there’s the cathode price. That’s stated in the LME, and Shanghai and the COMEX in the states. But if the market is tight in any of those regions locally, you will see a cathode premium … over the price of the copper,” he said. “People are willing to pay more to incentivize people that have copper inventory to release it into the market.’

Copper price in Q3

Copper supply and demand both saw growth during Q3.

The International Copper Study Group reported in an October 21 release that mined production of copper had increased by 2 percent year-on-year to 14.86 million MT during the first eight months of 2024.

Much was owed to 3 percent growth from Chile, with increases at BHP’s (ASX:BHP,NYSE:BHP,LSE:BHP) Escondida mine, as well as the Collahausi mine, which is a joint venture between Anglo American (LSE:AAL,OTCQX:AAUKF), Glencore (LSE:GLEN,OTC Pink:GLCNF) and Mitsui (OTC Pink:MITSF,TSE:8031).

Output from the Democratic Republic of Congo increased 11 percent, while Indonesia’s production rose 22 percent.

At the same time, demand increased slightly by 2.5 percent. Much of the additional demand came from 2.7 percent growth in Asian markets, which includes a 0.5 percent increase in Chinese refined copper imports.

Investor takeaway

The copper market has been tight all year, with new demand accelerating beyond new mine supply.

This demand growth is expected to continue as the world transitions from fossil fuels to renewable technologies that require more copper, like wind and solar. However, copper demand is still constrained by weakness in the Chinese economy, particularly in its housing sector, which is an important driver of global demand for the metal.

Ultimately, in the longer term, copper supply will be lacking from new projects and expanded production to meet demand. The base metal is expected enter a supply deficit over the next few years.

Securities Disclosure: I, Dean Belder, hold no direct investment interest in any company mentioned in this article.

This post appeared first on investingnews.com

A South Korean court on Tuesday approved an arrest warrant for President Yoon Suk Yeol, who was stripped of his presidential powers just weeks ago over his short-lived martial law decree that threw the country into political chaos.

This is the first time a sitting South Korean president has faced an arrest warrant granted by a court.

South Korea’s parliament voted to impeach Yoon on December 14 in an extraordinary rebuke that came about after his own ruling party turned on him following his refusal to resign.

South Korea’s anti-corruption agency said the Seoul Western District Court granted the warrant for Yoon, who is facing a probe on charges of abuse of authority and orchestrating a rebellion after he announced martial law on December 3.

The arrest warrant was issued after Yoon, a former prosecutor, had refused to answer three summonses by investigators in recent weeks asking for his cooperation, according to the Corruption Investigation Office (CIO).

The CIO said an arrest warrant must usually be executed within seven days but can be extended.

This is a developing story.

This post appeared first on cnn.com

The Taliban say they will close all national and foreign nongovernmental groups in Afghanistan employing women, the latest crackdown on women’s rights since they took power in August 2021.

The announcement comes two years after they told NGOs to suspend the employment of Afghan women, allegedly because they didn’t wear the Islamic headscarf correctly.

In a letter published on X Sunday night, the Economy Ministry warned that failure to comply with the latest order would lead to NGOs losing their license to operate in Afghanistan.

The United Nations said the space for women in Afghanistan has shrunk dramatically in the last two years and reiterated its call for the Taliban to reverse the restrictions.

“This really impacts how we can provide life saving humanitarian assistance to all the people in Afghanistan,” UN associate spokesperson Florencia Soto Nino-Martinez said. “And obviously we are very concerned by the fact that we are talking about a country where half the population’s rights are being denied and are living in poverty, and many of them, not just women, are facing a humanitarian crisis.”

The Economy Ministry said it was responsible for the registration, coordination, leadership and supervision of all activities carried out by national and foreign organizations.

The government was once again ordering the stoppage of all female work in institutions not controlled by the Taliban, according to the letter.

“In case of lack of cooperation, all activities of that institution will be canceled and the activity license of that institution, granted by the ministry, will also be canceled.”

It’s the Taliban’s latest attempt to control or intervene in NGO activity.

Earlier this month, the UN Security Council heard that an increasing proportion of female Afghan humanitarian workers were prevented from doing their work even though relief work remains essential.

According to Tom Fletcher, a senior UN official, the proportion of humanitarian organizations reporting that their female or male staff were stopped by the Taliban’s morality police has also increased.

The Taliban deny they are stopping aid agencies from carrying out their work or interfering with their activities.

They have already barred women from many jobs and most public spaces, and also excluded them from education beyond sixth grade.

In another development, the Taliban leader Hibatullah Akhundzada has ordered that buildings should not have windows looking into places where a woman might sit or stand.

According to a four-clause decree posted on X late Saturday, the order applies to new buildings as well as existing ones.

The United Nations also called for a reversal of this restriction, Soto Nino-Martinez said.

The decree said windows should not overlook or look into areas like yards or kitchens. Where a window looks into such a space then the person responsible for that property must find a way to obscure this view to “remove harm,” by installing a wall, fence or screen.

Municipalities and other authorities must supervise the construction of new buildings to avoid installing windows that look into or over residential properties, the decree added.

A spokesman for the Ministry of Urban Development and Housing was not immediately available for comment on Akhundzada’s instructions.

This post appeared first on cnn.com

The World Health Organization has urged China to share data to help understand the origins of Covid-19, five years on from the start of the pandemic in the Chinese city of Wuhan.

On December 31, 2019, the WHO’s China office noted a cluster of “pneumonia” cases in a statement from health authorities in Wuhan. More than three weeks later, Chinese authorities locked down the city of 11 million.

Fears of a rapidly spreading virus gripped the nation, but – as authorities would later learn – the coronavirus had already spread far beyond China.

While much of the world has moved on from the pandemic lockdowns and restrictions, many questions remain about the source of a virus that killed at least seven million people, crippled health care systems and upended the global economy. And many experts say China’s opacity has made finding answers to the pandemic’s origins harder.

“We continue to call on China to share data and access so we can understand the origins of COVID-19. This is a moral and scientific imperative,” the WHO said in a statement on Monday.

“Without transparency, sharing, and cooperation among countries, the world cannot adequately prevent and prepare for future epidemics and pandemics.”

How the pandemic started has been a subject of intense scientific scrutiny as well as heated political debates, with opinions divided primarily over whether it originated from a natural animal spillover or a lab leak.

Many scientists believe the virus originated in the wild, before it jumped from infected animals to humans and spread through a wet market in Wuhan, though they haven’t been able to identify the intermediate host.

Suspicions that the coronavirus was leaked from a laboratory near the market, which was first dismissed as a conspiracy theory, have persisted and been endorsed by some researchers.

The search for the origins of the virus has been hugely controversial from the onset and a key source of political tension. The United States and other Western countries have repeatedly accused China of withholding access to original and complete data – which Beijing has vehemently denied.

WHO officials have also criticized China’s tight control of data access, with one official calling its lack of data disclosure “simply inexcusable” in 2023.

Chinese disease control officials responded at the time, saying China had provided the WHO’s expert group with all information it had on the origins of the virus “without withholding any cases, samples, or their testing and analysis results.”

For years, the global health agency has sought access to test results from workers at the market, as well as other raw data that China collected early on in the pandemic.

It was only in 2023, three years after the start of the pandemic, that WHO got access to certain data that Chinese scientists had gathered in early 2020 at the Huanan Seafood Market in Wuhan. The raw genetic sequences from the samples had been uploaded to the data-sharing site GISAID. They were soon removed, but quick-thinking researchers had already noticed them and downloaded them for further study.

An analysis of that material, published in the peer-reviewed journal Cell in September, showed that coronavirus-susceptible animals and the coronavirus that causes Covid-19 were present at a specific section of the market, although the study did not confirm whether the animals themselves were infected with the virus.

In its statement on Monday, the WHO recounted how on December 31, 2019, its country office in China picked up a statement from the Wuhan municipal health commission’s website on cases of “viral pneumonia” in the city.

“In the weeks, months and years that unfolded after that, COVID-19 came to shape our lives and our world,” it said.

“As we mark this milestone, let’s take a moment to honour the lives changed and lost, recognize those who are suffering from COVID-19 and long COVID, express gratitude to the health workers who sacrificed so much to care for us, and commit to learning from COVID-19 to build a healthier tomorrow.”

This post appeared first on cnn.com

When the ball drops in New York City’s Times Square to herald the start of 2025, it’ll actually be late to the party as dozens of countries around the world will already have welcomed the new year.

Kiribati is an island country in the central Pacific Ocean, and its largest island, Kiritimati, will be the first place to kick off 2025 when it is just 5 a.m. on December 31 on the East Coast of the United States and 11 a.m. UTC (Coordinated Universal Time, the global standard).

The Pacific Island nation will be followed by Chatham Islands in New Zealand at 5:15 a.m. ET and then most of New Zealand at 6 a.m., along with Tokelau, Samoa, Tonga, Kiribati’s Phoenix Islands and some regions of Antarctica.

Meanwhile, on the other side of the international date line, Hawaii, American Samoa, and many of the US outlying islands will be among the last places to pop Champagne corks. They’ll have to wait until Wednesday morning (Eastern Time) to toast 2025.

In all, there are 39 different local time zones in use across the globe – some differing by 15 or 30 minutes compared to nearby zones – including two which are more than 12 hours ahead of UTC, which means it takes 26 hours for the entire world to welcome the New Year.

So, if you really, really, really love to hum “Auld Lang Syne,” the list below will get you in the spirit over and over and over again as the day rolls around.

Here’s when places around the world will be ringing in the New Year, relative to East Coast time.

Tuesday, December 31, 2024

5 a.m. ET Kiritimati, which is also known as Christmas Island and forms part of the Micronesian island nation of Kiribati

5:15 a.m. ET Chatham Islands, off the eastern coast of New Zealand

6 a.m. ET Most of New Zealand (with a few exceptions) and Tokelau, Samoa, Tonga, Kiribati’s Phoenix Islands and some regions of Antarctica

7 a.m. ET Fiji, a small part of eastern Russia, and several more Pacific islands, including the Marshall Islands and Tuvalu

8 a.m. ET Much of Australia including Melbourne and Sydney and seven more locations, including Vanuatu, the Solomon Islands, Bougainville in Papua New Guinea, and New Caledonia

8:30 a.m. ET A small region of Australia including Adelaide

9 a.m. ET Australia’s state of Queensland and six more locations, including parts of Micronesia, the Northern Mariana Islands, a small part of Antarctica, and Guam

9:30 a.m. ET Australia’s Northern Territory

10 a.m. ET Japan, South Korea, a small part of Russia, North Korea, a small part of Indonesia, Timor-Leste, and Palau

10:15 a.m. ET Western Australia

11 a.m. ET China, Philippines, Malaysia, parts of Indonesia, most of Mongolia, Taiwan, Brunei, Russia’s Irkutsk region, some parts of Antarctica, Hong Kong, Singapore, and Macao

Noon ET Much of Indonesia, Thailand, Vietnam, Cambodia, Laos, some parts of Russia, some parts of Mongolia, a small region of Antarctica, and Australia’s Christmas Island

12:30 p.m. ET Myanmar and the Cocos Islands, an Australian territory

1 p.m. ET Bangladesh, parts of Kazakhstan, Kyrgyzstan, Bhutan, the British Indian Ocean Territory, the city of Omsk in Russia, and a small part of Antarctica

1:15 p.m. ET Nepal

1:30 p.m. ET India and Sri Lanka

2 p.m. ET Pakistan, some parts of Russia, much of Kazakhstan, Uzbekistan, Turkmenistan, the Maldives, Tajikistan, French Southern territories, France’s Kerguelen islands, and a small region of Antarctica

2:30 p.m. ET Afghanistan

3 p.m. ET Azerbaijan, the United Arab Emirates, Armenia, a small region of Russia, Oman, much of Georgia, Frances’ Réunion Island, Mauritius, and the Seychelles

3:30 p.m. ET Iran

4 p.m. ET Moscow in Russia, Turkey, Saudi Arabia, Iraq, Ethiopia, Somalia, and Kenya, in addition to 17 other locations

5 p.m. ET Greece, Egypt, Lebanon, Rwanda, Romania, and 26 other locations

6 p.m. ET Germany, Nigeria, Algeria, Italy, Belgium, Morocco, Albania, France and 38 other locations

7 p.m. ET United Kingdom, Portugal, Iceland, Burkina Faso, Senegal, Ghana, Sierra Leone, and 18 other locations

8 p.m. ET Cabo Verde, the Azores – which are made up of nine enchanting islands in the Atlantic but are part of Portugal – and a small region of Greenland

9 p.m. ET Most of Greenland, the Brazilian state of Pernambuco, and South Georgia and the South Sandwich Islands

10 p.m. ET Most of Brazil, Argentina, Chile with exceptions, Uruguay, parts of Antarctica, Paraguay, French Guiana, Suriname, Saint Pierre and Miquelon, and the Falkland Islands

10:30 p.m. ET Canada’s Newfoundland and Labrador province

11 p.m. ET Some regions of Canada, Venezuela, Bolivia, Puerto Rico, the Dominican Republic, Aruba, Guyana, and 23 other locations

Wednesday, January 1, 2025

Midnight The East Coast of the USA (including New York City, Washington, D.C., and Detroit), parts of Canada, Colombia, Ecuador, Peru, Cuba, Acre in Brazil, Panama, a small part of Mexico, Haiti, Bahamas, Turks and Caicos Islands, Jamaica, a small region of Chile, and the Cayman Islands

1 a.m. ET Central USA (including Chicago), much of Mexico (including Mexico City), parts of Canada, Honduras, Belize, Nicaragua, Costa Rica, El Salvador, Guatemala, and a small part of Ecuador

2 a.m. ET US (Mountain time zone, including Denver and Phoenix), parts of Canada (including Edmonton and Calgary), and parts of Mexico

3 a.m. ET US (Pacific time zone, including Los Angeles and San Francisco), British Columbia in Canada, Baja California in Mexico, Pitcairn Islands, and Clipperton Island

4 a.m. ET Alaska in the US and regions of French Polynesia

4:30 a.m. ET Marquesas Islands in French Polynesia

5 a.m. ET Hawaii in the US, Tahiti in French Polynesia, and the Cook Islands

6 a.m. ET American Samoa, parts of the US minor outlying islands (including the Midway Atoll), and Niue, an island nation in the South Pacific Ocean

7 a.m. ET Much of US minor outlying islands (unincorporated US territories in the Pacific), including Baker Island and Howland Island

This post appeared first on cnn.com